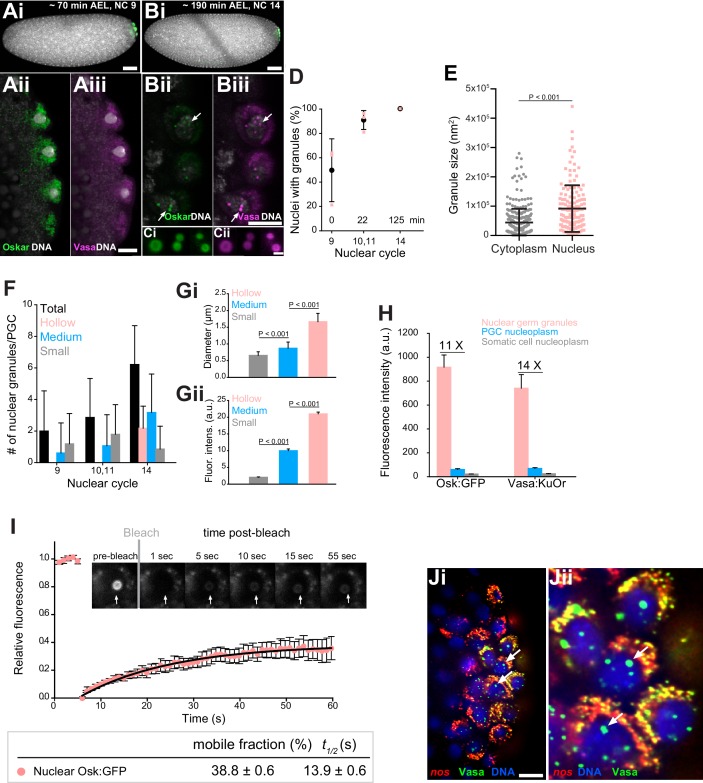
Figure 2. Core germ granule proteins Oskar and Vasa form phase transitioned nuclear germ granules in primordial germ cells.
(A-B) Drosophila embryos stained with an antibody against Oskar (Ai,Bi) (green) and counter-stained for DNA with DAPI (white) or expressing Osk:GFP (green) and Vasa:KuOr (magenta) (Aii,Aiii, Bii,Biii) and counter stained with DAPI (white) at NC nine and 14. White arrows point at hollow nuclear germ granules. (C) Close-up of nuclear germ granules marked by Osk:GFP (i, green) and Vasa:KuOr (ii, magenta) at NC 14. (D) Appearance of nuclear granules in PGCs at NC nine (0 min), NC 10,11 (22 min) and NC 14 (125 min). The number of PGCs with nuclear germ granules was counted at each NC. Three embryos per NC were analyzed and an average percent of granule-containing nuclei per embryo per NC calculated (pink circles). Mean ±STDEV is shown. (E) Nuclear germ granules are larger than cytoplasmic germ granules (91797 nm2 = 606.0 nm diameter vs. 44533 nm2 = 422.1 nm diameter, respectively; unpaired t-test, p<0.0001). Mean ±STDEV is shown. (F) Number of nuclear granules per PGC through early embryogenesis. PGCs of two Vasa:GFP expressing embryos per NC were analyzed and mean ±STDEV of total (black bars), small (grey), medium (blue) and hollow (pink) number of nuclear germ granules per PGC per NC determined. Gi,ii Small, medium and hollow nuclear granules differ in their size (i) and amount of protein (ii) (statistical significance: two-tailed t-test). Mean ±STDEV of 20 to 31 granules is shown. (H) Levels of Osk:GFP and Vasa:KuOr fluorescence in nuclear germ granules (pink bar), in the PGC nucleoplasm (blue bar) and in the somatic cell nucleoplasm (grey bar). 11X and 14X fold enrichment of Osk:GFP and Vasa:KuOr fluorescence relative to the PGC nucleoplasm, respectively, is shown. For each bar, mean fluorescent levels ± SEM of nine granules, 12 ROIs in the PGC nucleoplasm and 15 ROIs in somatic cell nucleoplasm are shown (see Figure 1—figure supplement 1B). (I) FRAP of nuclear Osk:GFP germ granules in PGCs. Mean ±SEM of eight hollow nuclear germ granules is shown. Black line shows the fit to the experimental data. Below the graph, the % mobile fraction and t1/2 derived from I is shown. Images in the graph show fluorescence recovery before and after photobleaching. White arrow points at the bleached granule. (J) i,ii smFISH reveals that germ plasm mRNA nos (red) is enriched in cytoplasmic, but not in nuclear germ granules (green). DNA stained with DAPI is shown in blue. ii close-up of Ji. Arrows point at nuclear germ granules lacking nos smFISH signal. Scale bar in Cii is 1 μm and in Aiii, Biii, Ji is 10 μm and in Ai, Bi is 50 μm.


