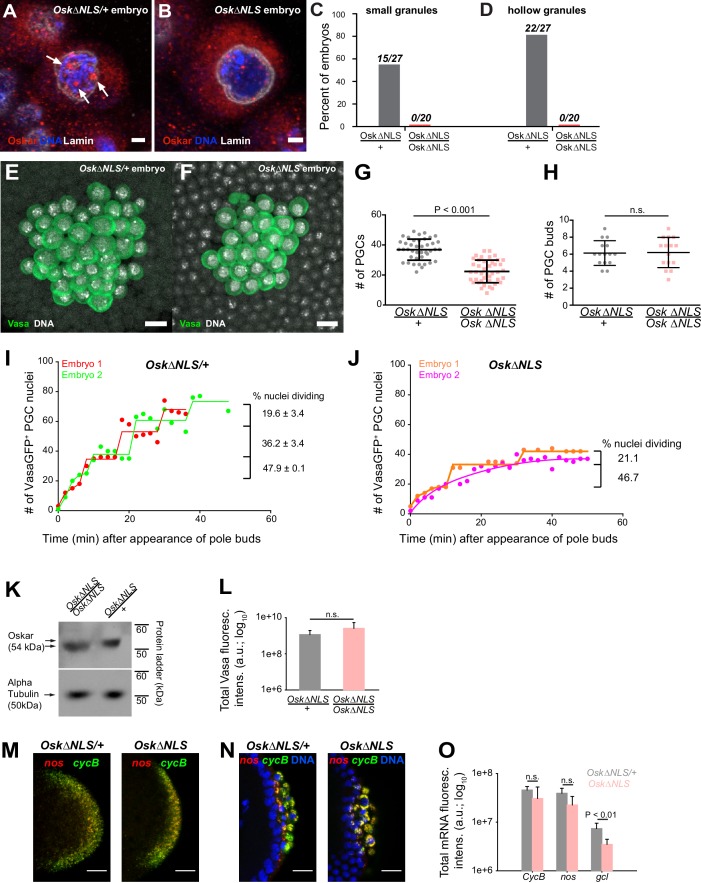
Figure 7. Ablation of nuclear germ granules reduces cell divisions in PGCs.
(A,B) Oskar∆NLS/+ PGCs (A) form nuclear germ granules (white arrows) while Oskar∆NLS PGCs do not (B). Granules were immunostained against Osk (red). DAPI-stained DNA is shown in blue and nuclear lamin is shown in white. (C,D) Number of embryos with small (C) and hollow (D) nuclear germ granules stained with α-Osk in Oskar∆NLS and Oskar∆NLS/+ PGCs. In both the total number of embryos counted is written above the graph bars. (E,F) Cross-section of the posterior pole of an embryo with Oskar∆NLS/+ (A) and Oskar∆NLS (B) maternal genotype immunostained against Vasa (green) and DAPI (white). G Number of PGCs in 41 Oskar∆NLS/+ and 42 Oskar∆NLS embryos. Mean ± STDEV is plotted (statistical significance: unpaired t-test, p<0.001). (H) PGC buds in 15 Oskar∆NLS/+ and 14 Oskar∆NLS embryos. Mean ± STDEV is plotted (statistical significance: unpaired t-test). (I,J) Quantification of PGC divisions in live Oskar∆NLS/+ (I) and Oskar∆NLS (J) embryos. The emergence of the first PGC bud represented time 0 and the cellularization of somatic nuclei at NC 14 represented the end of the experiment. The number of Vasa:GFP associated HiS2Av:mRFP-stained nuclei was counted in three dimensions at every time point (red, green, orange and violet circles). Lines represent an estimated progression among successive cell divisions. Percent of dividing Vasa:GFP +nuclei is marked on each graph (Figure 7—video 1 and 2). Note, that in live observation, the total number of PGCs was higher than in fixed embryos (compare G with I and J). We attribute this to the fact that we counted all nuclei with even a small amount of Vasa:GFP associated, which may not have cellularized and become PGCs and thus would not have been counted as PGCs in fixed tissue. (K) Western blot of Oskar protein in Oskar∆NLS and Oskar∆NLS/+ embryos. α-tubulin was used for normalization control. L Total amount of Vasa germ plasm fluorescence in Oskar∆NLS and Oskar∆NLS/+ embryos marked with an antibody against Vasa. Mean total fluorescent levels ± STDEV of eight (Oskar∆NLS/+) and 13 (Oskar∆NLS) embryos per genotype are shown (statistical significance: two-tailed t-test). (M,N) Early embryos (M) and late embryos (N) hybridized with nos (red) and CycB (green) smFISH probes. DAPI-stained nuclei are shown in blue. O Quantification of localized mRNA levels hybridized with CycB, nos and gcl smFISH probes. Mean total fluorescent levels ± STDEV of four CycB and nos-stained embryos per genotype are shown and mean total fluorescent levels ± STDEV of four (Oskar∆NLS/+) and five (Oskar∆NLS) gcl-stained embryos are shown (statistical significance: two-tailed t-test). Scale bar in A,B is 2 μm and in E,F,M,N is 10 μm.


