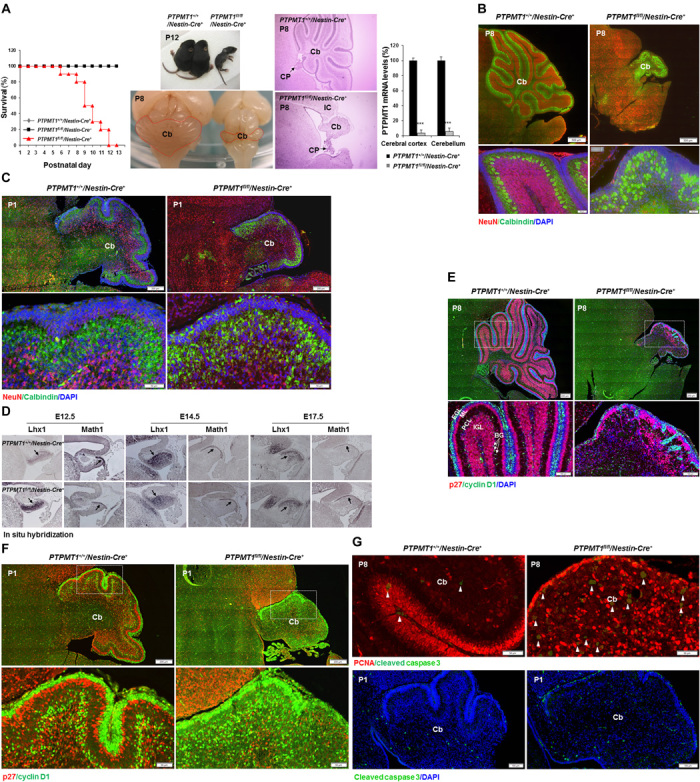
Fig. 1. Depletion of PTPMT1 from neural precursor cells blocks postnatal cerebellar development.

(A) Kaplan-Meier survival curves of PTPMT1fl/fl/Nestin-Cre+ (n = 18), PTPMT1+/+/Nestin-Cre+ (n = 20), and PTPMT1fl/fl/Nestin-Cre− (n = 18) mice. PTPMT1+/+/Nestin-Cre+ and PTPMT1fl/fl/Nestin-Cre+ mice and brains at P12 were photographed. Representative cerebella and cerebellar sections [hematoxylin and eosin (H&E) staining] of PTPMT1+/+/Nestin-Cre+ and PTPMT1fl/fl/Nestin-Cre+ mice at P8 are shown. Cb, cerebellum; IC, inferior colliculus; CP, choroid plexus. PTPMT1 mRNA levels in freshly isolated cerebra and cerebella with the indicated genotypes (n = 3) were determined by quantitative reverse transcription polymerase chain reaction (qRT-PCR). (B and C) Brain sections prepared from PTPMT1+/+/Nestin-Cre+ and PTPMT1fl/fl/Nestin-Cre+ mice at the indicated ages were processed for immunofluorescence staining with the indicated antibodies, followed by 4′,6′-diamidino-2-phenylindole (DAPI) counterstaining. (D) Cryosections of hindbrains with the indicated genotypes at E12.5, E14.5, and E17.5 were hybridized with digoxigenin (DIG)–labeled probes specific for mouse Lhx1 and Math1 mRNA. Arrows indicate Math1+ or Lhx1+ cells. (E to G) Brain sections prepared from PTPMT1+/+/Nestin-Cre+ and PTPMT1fl/fl/Nestin-Cre+ mice at the indicated ages were processed for immunofluorescence staining with the indicated antibodies, followed by DAPI counterstaining. EGL, external granule layer; PCL, Purkinje cell layer; IGL, internal granule layer; ML, molecular layer. Arrowheads in (G) indicate cleaved caspase 3+ apoptotic cells. Representative images from three mice per genotype are shown.
