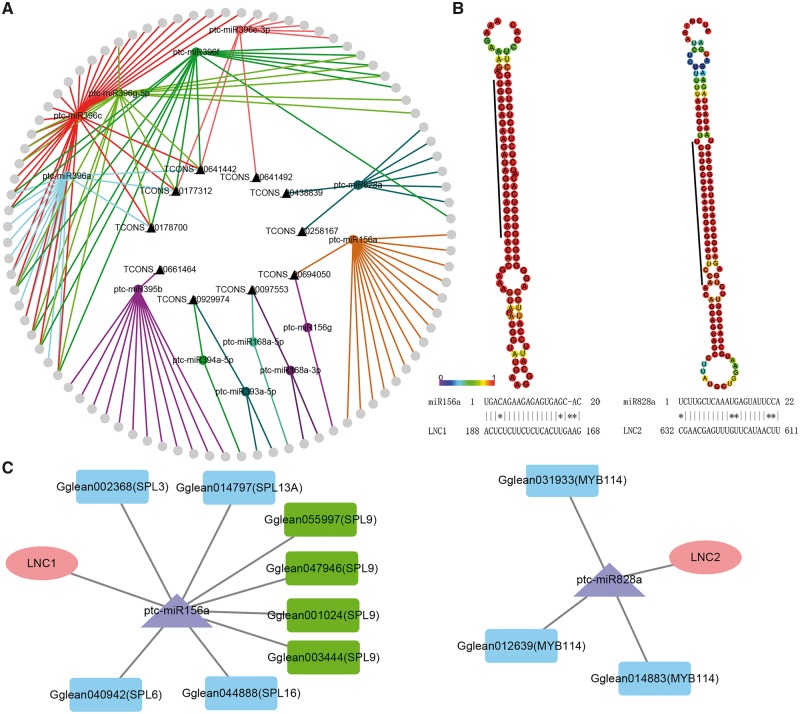
Figure 2.
Analysis of lncRNA-miRNA-mRNA networks. (A) The networks of lncRNA-miRNA-mRNA. The triangle represents lncRNAs, the circle with label represents miRNAs, and the circle without label represents mRNAs. (B) LNC1/2 as endogenous target mimics (eTMs) of miRNAs. Secondary structure of miRNAs precursors and the basepairing relationship between lncRNA and miRNAs. The predicted secondary structure was generated using RNAfold. (C) Sub interaction networks of LNC1/2 from lncRNA-miRNA-mRNA networks. The ellipse represents lncRNAs, the triangle represents miRNAs, and the rectangle represents mRNAs.

