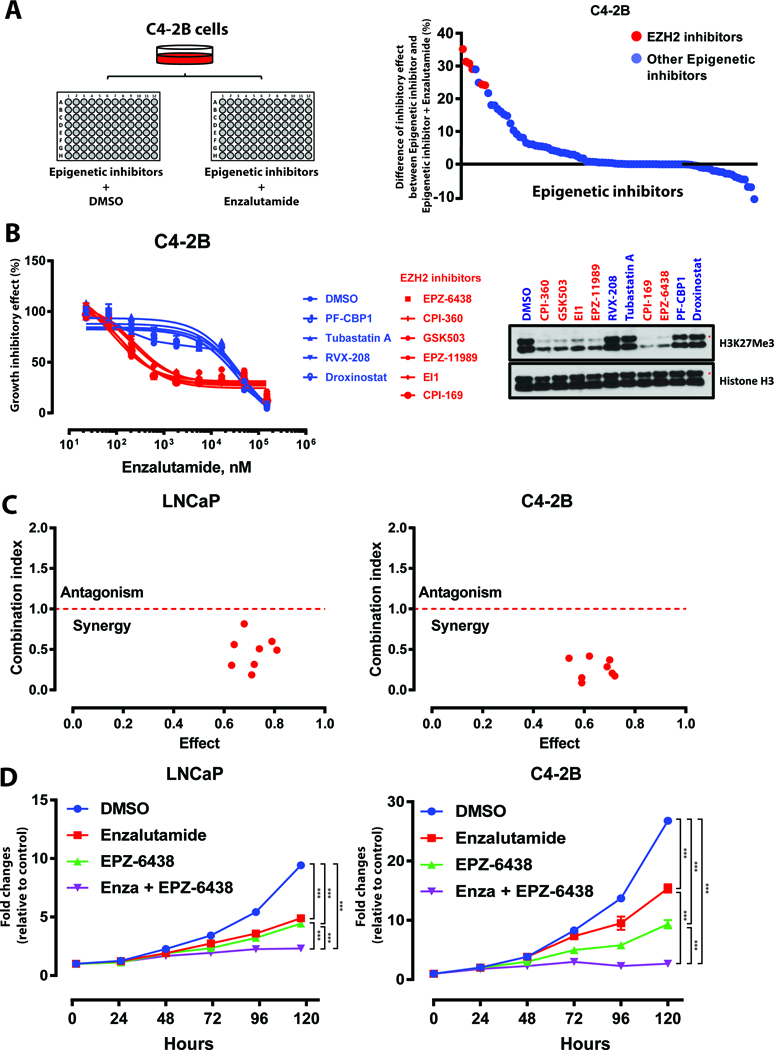
Figure 1. Identification of EZH2 as a key target for enzalutamide sensitization.

A. Diagram depicting screen performed in C4–2B cells treated with epigenetic inhibitor panel plus enzalutamide (2 μM) or DMSO control. Degree of proliferation inhibition for each individual inhibitor (1 μM) plus enzalutamide versus each inhibitor alone is graphed (all normalized to DMSO).
B. Dose response curves of C4–2B cells treated with enzalutamide in combination with each of the 10 most effective epigenetic inhibitors (1 μM). Data represent mean ± standard error (n = 3) from one of three independent experiments. Immunoblot analysis of H3K27Me3 levels in C4–2B cells treated with each epigenetic inhibitor demonstrated EZH2 inhibition with red compounds.
C. Combination index analysis (CI) for the combination of EPZ-6438 and enzalutamide. Circles represent experimentally determined CI values (Chou-Talalay method).
D. Growth curves of LNCaP and C4–2B cells treated with DMSO, enzalutamide (Enza, 2 μM), EPZ-6438 (1 μM), and combination of enzalutamide plus EPZ-6438. Data represent mean ± standard error (n = 6) from one of three independent experiments.
The experiment was conducted in biological triplicate. When not otherwise indicated, data shown as representative experiments, with each point representing the mean (± SD) of technical duplicates (t test). ***, P < 0.001.
