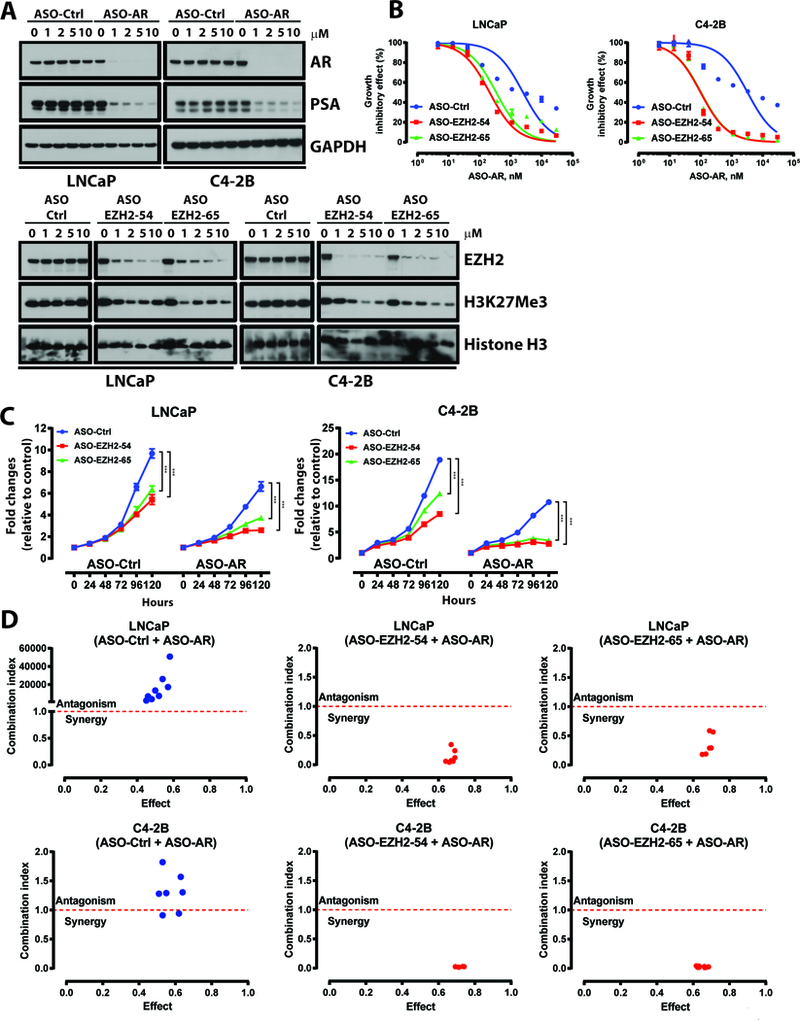
Figure 2. EZH2- and AR-targeting ASOs synergistically inhibit prostate cancer growth.

A. Top, immunoblot analysis of AR and PSA in LNCaP and C4–2B cells treated with ASO-Ctrl or ASO-AR. ASOs were delivered to cells in all experiments via free uptake. Bottom, immunoblot analysis of EZH2 and H3K27Me3 in LNCaP and C4–2B cells treated with ASO-Ctrl and EZH2 ASOs (EZH2–54 and EZH2–65).
B. Dose response curves of LNCaP and C4–2B cells treated with ASO-Ctrl or ASO-EZH2 (EZH2–54 and EZH2–65, 1 μM), then treated with ASO-AR for five days. Data represent mean ± standard error (n = 3) from one of three independent experiments.
C. Growth curves of LNCaP and C4–2B cells treated with ASO-Ctrl, ASO-AR, ASO-EZH2 (EZH2–54 and EZH2–65, 1 μM), or combination of ASO-AR (1 μM) plus ASO-EZH2 (1 μM). Data represent mean ± standard error (n = 6) from one of three independent experiments.
D.Combination index analysis (CI) for the combination of ASO-AR and EZH2 ASOs. Circles represent experimentally determined CI values (Chou-Talalay method).
The experiment was conducted in biological triplicate. When not otherwise indicated, data shown as representative experiments, with each point representing the mean (± SD) of technical duplicates (t test). ***, P < 0.001.
