
Figure 3. EZH2 inhibition enhances AR signaling and genome-wide AR binding.
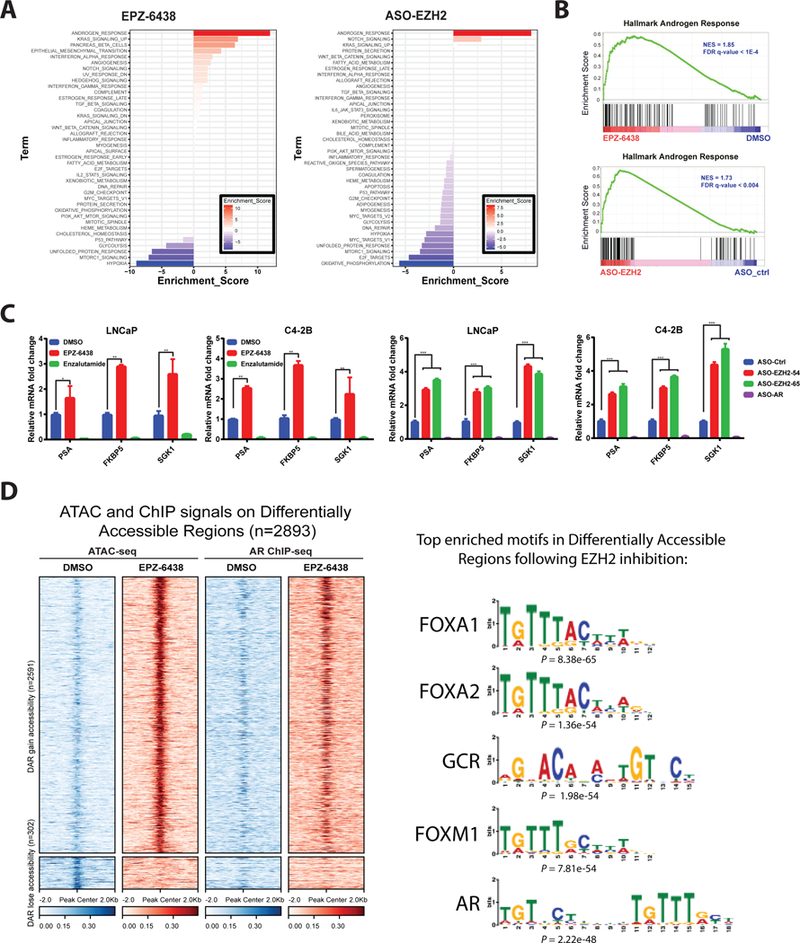
A. Transcriptomic changes induced in C4–2B cells by treatment with EPZ-6438 and ASO-EZH2, as determined by RNA-seq with GO analysis. GO enrichment p values and number of genes in each GO category are respectively indicated at the x-axis and next to the bar. “Androgen Response” was the top activated gene set by either agent.
B. EPZ-6438 and ASO-EZH2-mediated elevation of AR signaling as demonstrated by GSEA. Hallmark Androgen Response gene sets shown for C4–2B cells treated with EPZ-6438 or ASO-EZH2.
C. qRT–PCR analysis of AR target gene in LNCaP and C4–2B cells treated with DMSO, EPZ-6438, or enzalutamide for 72 h (left) or designated ASOs for 72h (right). Data represent mean ± SEM (n = 3) from one of three independent experiments.
D. Heatmaps of ATAC-seq and AR ChIP-seq signals around ± 2kb of peak center (left). Each row represents ± 2kb around the center of differentially accessible regions (DAR). Top panel represents 2591 DAR that gain accessibility upon EPZ-6438 treatment compared to DMSO. Bottom panel represents 302 DAR that lose accessibility upon EPZ-6438 treatment compared to DMSO. (Right) Motif analysis showing enriched motifs in open chromatin upon EPZ-6438 treatment.