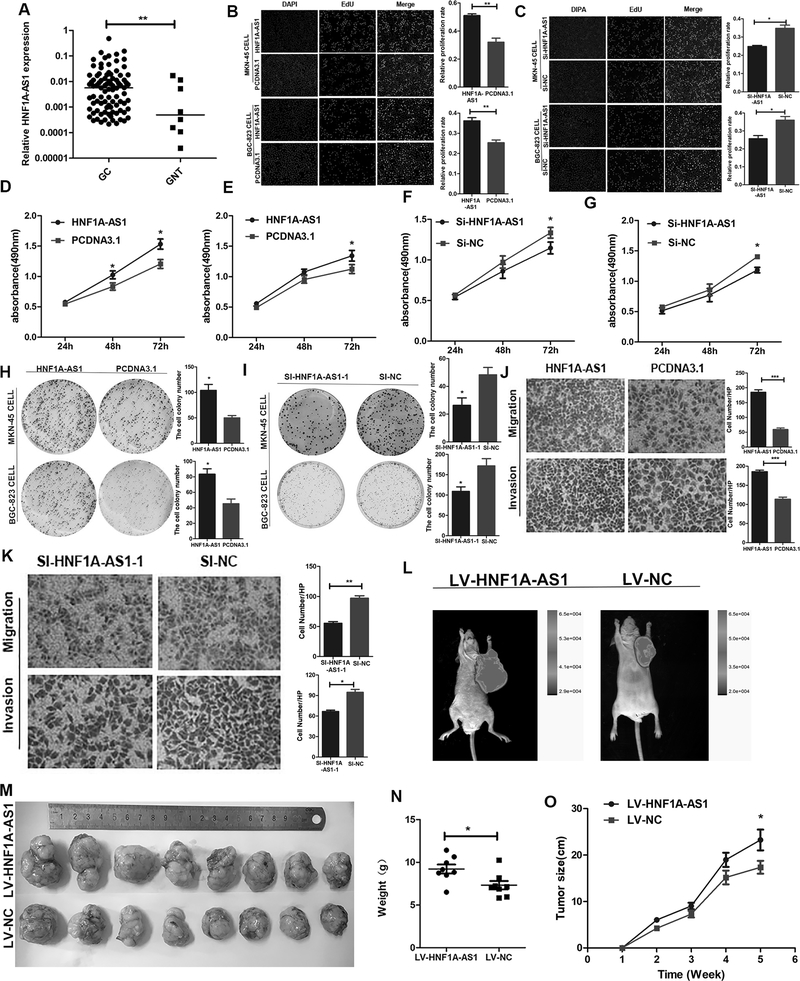
Figure 1. HNF1A-AS1 promotes GC cell growth and invasion.
(A). HNF1A-AS1 expression was analyzed by qRT-PCR in GC tissues (n = 99) and adjacent normal tissues (n = 8). HNF1A-AS1 expression level was normalized to that of GAPDH.
(B-C). MKN-45 and BGC-823 cells growth was enhanced as evaluated by the EdU assay (B). And HNF1A-AS1 knockdown inhibited cell proliferation activities in both two cell lines (C). Three independent experiments were performed, and data are presented as mean ± SD.
(D-G). The cell growth rates were determined with MTS proliferation assays. Three independent experiments were performed, and data are presented as mean ± SD.
(H-I). Colony formation assays were used to explore the cell colony formation ability of HNF1A-AS1 and Si-HNF1A-AS-1–transfected cells. Three independent experiments were performed, and data are presented as mean ± SD.
(J-K). Migration and invasion ability of the BGC-823 cell lines by Transwell assays. Three independent experiments were performed, and data are presented as mean ± SD. (L). Five weeks post implantation, the tumors in Nu/Nu mice was measured by an in vivo imaging system.
(M). The HNF1A-AS1 stably expressing group or the negative control were used for tumorigenesis assay. Five weeks later, the mice were killed and the tumor nodules were harvested.
(N-O). Tumor growth curves after subcutaneous injection of MKN-45 cells containing a stable overexpression of HNF1A-AS1 or the negative control are shown. The tumor weights (N) and volumes (O) were measured every 7 days after inoculation.
*P < 0.05, ** P < 0.01, *** P < 0.001

