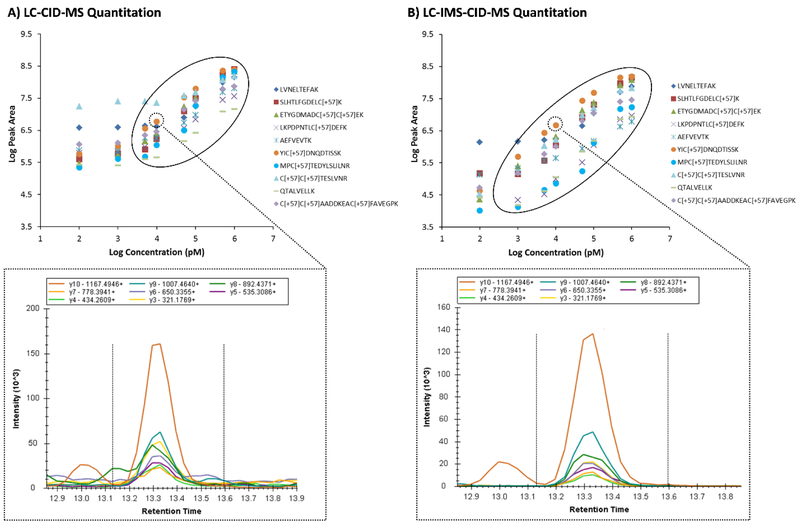
Figure 4.
Addition of the IMS dimension enables better quantitation in fragmentation data. Calibration curves for 10 BSA target peptides spiked into yeast and extracted in the A) LC-CID-MS and B) LC-IMS-CID-MS all-ions fragmentation spectra. Like the MS1 spectra, IMS filtering illustrated a greater dynamic range for all peptides due to the reduction of noise. A specific example of interference is illustrated in the bottom XICs for the baseline area around the transitions of YiC[+57]DNQDTISSK+ in the 10 nM BSA/yeast sample.

