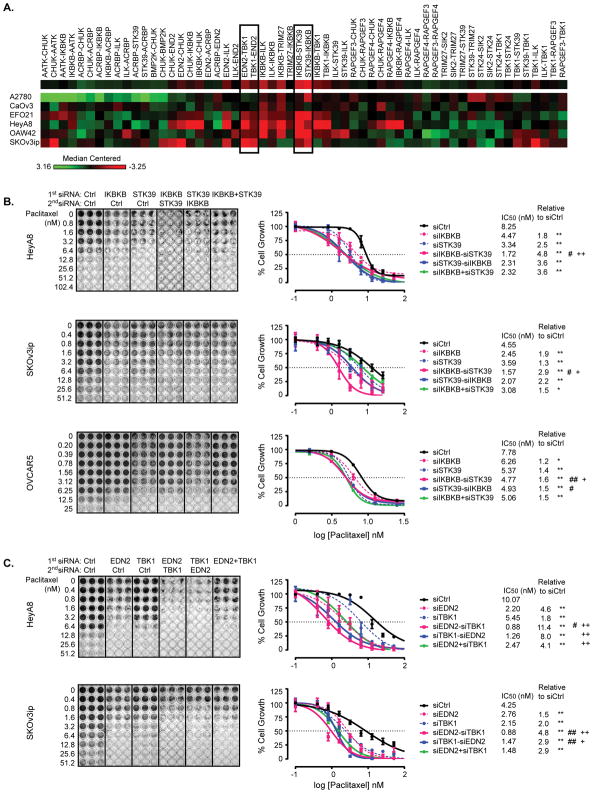
Figure 2. Sequential treatment with siIKBKB followed by siSTK39 or with siEDN2 followed by siTBK1 enhances paclitaxel sensitivity in ovarian cancer cells.
(A) A supervised heat-map represents medium-centered fold change of paclitaxel sensitivity after dual siRNA treatment. A2780, CaOv3, EFO21, HeyA8, OAW42 and SKOv3ip ovarian cancer -cells were treated with dual siRNA sequentially followed by paclitaxel treatment, and then cells were stained using SRB assay. A -hHeatmap was generated using median-centered fold changes of paclitaxel sensitivity. The fold changes of each kinase siRNA were calculated using the ratio of the SRB assay value normalized to that of control siRNA, with and without paclitaxel treatment. A heat map generated from normalized fold changes displays the differences of the z-scores. (B) Combination of IKBKB and STK39 treatment was examined in SKOv3ip, HeyA8 and OVCAR5 cell lines. Cells were treated with dual siRNA followed by addition of paclitaxel for 72 hrs. Cell growth was examined using an SRB assay. Cell mass was reflected by absorbance at 570 nm and the percentage of paclitaxel-induced growth inhibition was calculated for each target siRNA relative to control siRNA. Dose response curves were generated using non-linear regression with the Least Squares fitting method (GraphPad). IC50 of paclitaxel and fold changes of IC50 were calculated. (C) Combination of EDN2 and TBK1 was tested in SKOv3ip and HeyA8 cell lines. Cell treatments and growth curve plotting were conducted as described above. Data were obtained from three independent experiments. * p<0.05 and ** p<0.01 compared to siControl; # p<0.05 and ## p<0.01 compared to single siRNA against either IKBKB or EDN2; + p<0.05 and ++ p<0.01 compared to single siRNA against either STK39 or TBK1.

