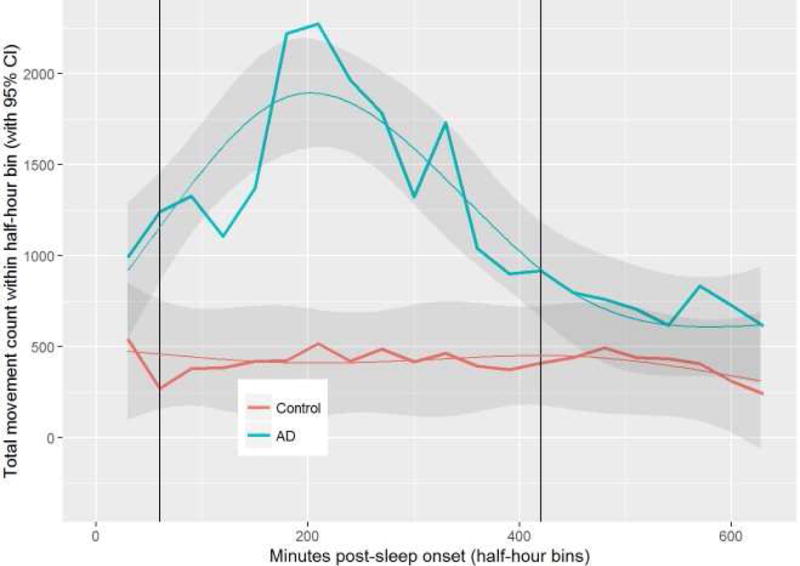
Figure 1. Total Movement Counts Peak Three Hours After Sleep Onset In Atopic Dermatitis.

Average total movement count is plotted on the Y-axis, with minutes post-sleep onset on the X-axis. Plot of mean observed and model predicted values (smoothed lines) with 95% confidence intervals as the shaded region in AD (n=19) versus controls (n=19). Groups are significantly different in the region between the vertical lines.
AD and control patients differ (p<0.001). The interaction between group and time is significant (p<0.001). There is also a significant time effect and it is not linear.
