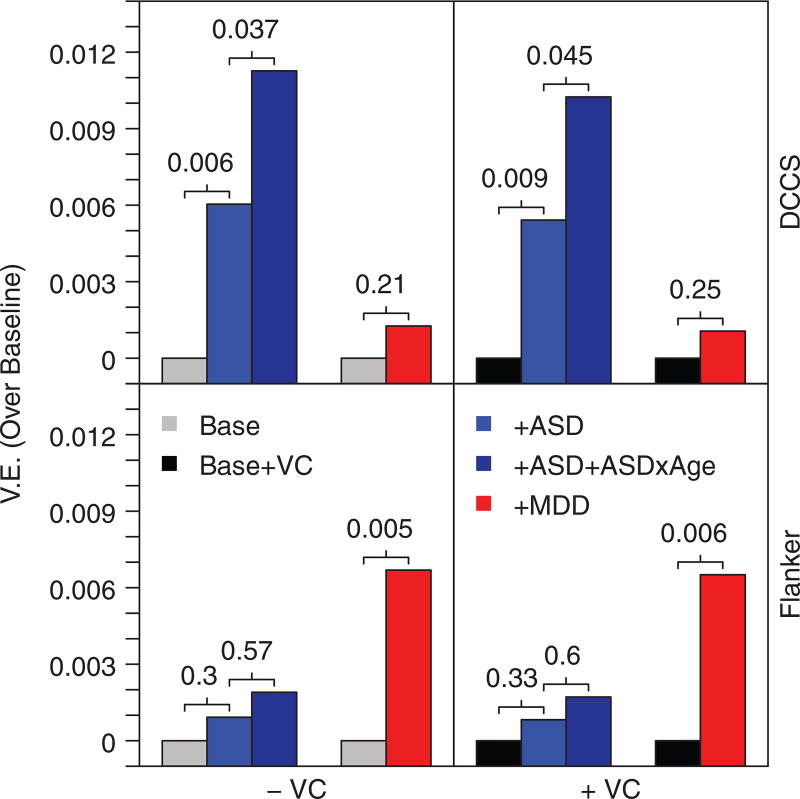
FIGURE 1.
ASD and MDD PRS associate with different executive components in the PING cohort. Bar heights reflect increments in VE over the baseline (covariates only) model. Numbers indicate P values obtained from LRTs that compare the models sequentially, left to right. VE, variance explained; ASD, autism spectrum disorder PRS; MDD, major depressive disorder PRS; VC, verbal composite; DCCS, dimensional change card sort

