
Figure 8.
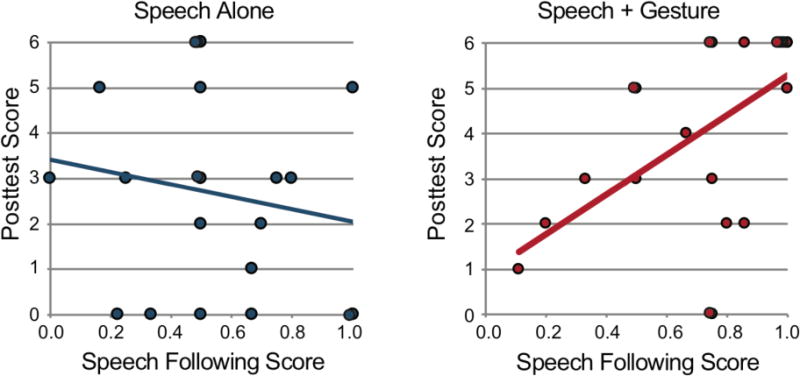
Relation between strategy segment Following Score and Posttest Score for the Speech Alone condition (left graph) and the Speech+Gesture condition (right graph).
Official websites use .gov
A
.gov website belongs to an official
government organization in the United States.
Secure .gov websites use HTTPS
A lock (
) or https:// means you've safely
connected to the .gov website. Share sensitive
information only on official, secure websites.
Relation between strategy segment Following Score and Posttest Score for the Speech Alone condition (left graph) and the Speech+Gesture condition (right graph).