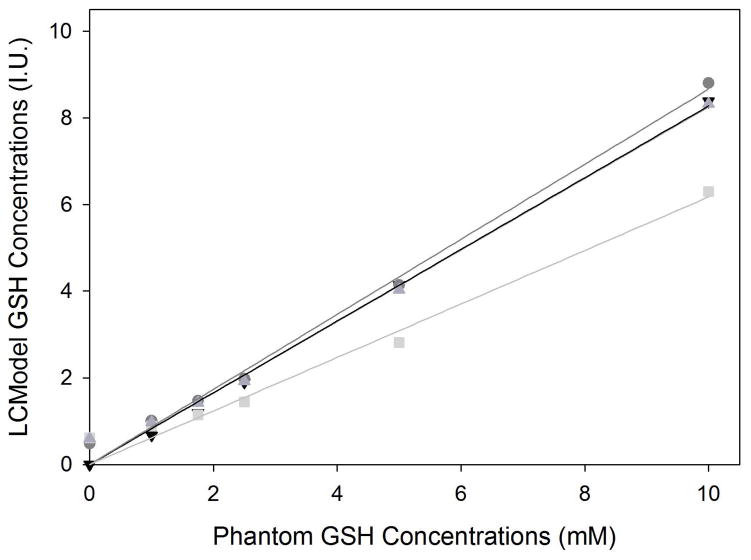
Figure 3.
Plots of actual versus quantified GSH levels from phantoms with varying concentrations of GSH are shown for each of the 4 sequences: SPECIAL (
 ), PR-STEAM (
 ), PRESS (
 ), and MEGA-PRESS (▼). At higher GSH levels, the sequences were similar in their ability to detect GSH. From the 0mM GSH phantom, MEGA-PRESS was the only sequence to report 0mM while the other non-edited sequences reported trace levels of GSH. The linear regressions for SPECIAL, MEGA-PRESS and PR-STEAM were similar such that MEGA-PRESS and PR-STEAM linear regression lines overlapped. Overall, linear fits to the data were excellent with R2 values of 0.996, 0.995, 0.987, and 0.998, respectively.

