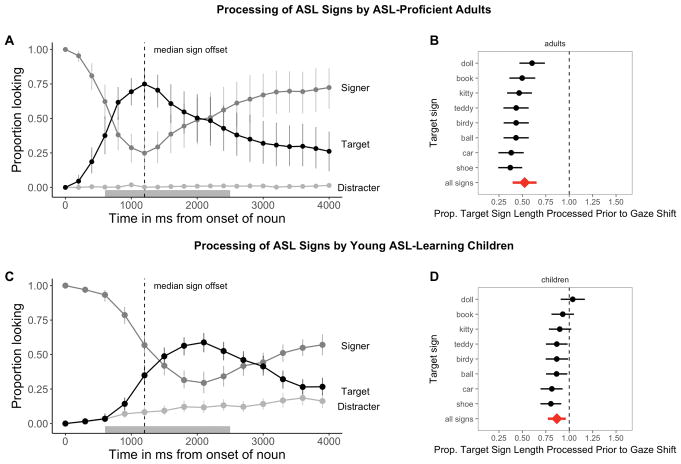
Figure 2.
The time course of looking behavior for ASL-proficient adults (2A) and young ASL-learners (2C). The curves show mean proportion looking to the signer (dark grey), the target image (black), and the distracter image (light grey). The grey shaded region marks the analysis window (600–2500ms); error bars represent +/− 95% CI computed by non-parametric bootstrap. The mean proportion of each target sign length (see the Methods section for details on how sign length was defined) processed prior to shifting visual attention away from the language source to a named object for adults (2B) and children (2D). The diamond indicates the mean estimate for all signs. The dashed vertical line corresponds to a median proportion of 1.0. A median of < 1.0 reflects response latencies that occur prior to the offset of the target sign; a median of ≥ 1.0 reflects response latencies that occur after target sign offset. Error bars represent 95% Highest Density Intervals.

