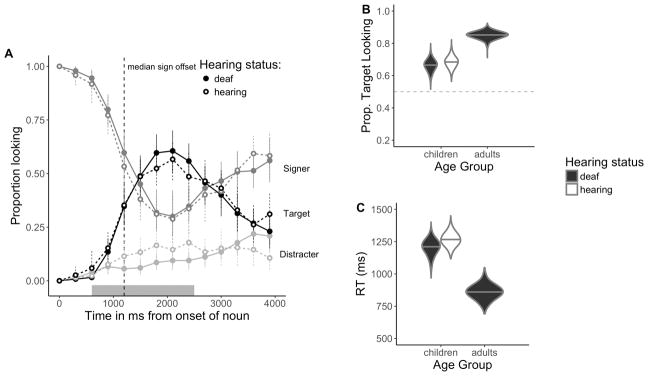
Figure 3.
The time course of looking behavior for young deaf and hearing ASL-learners (3A). Filled circles represent deaf signers, while open circles represent hearing signers; All other plotting conventions are the same as in Figure 2. Panels B and C show full posterior distributions over model estimates for mean Accuracy (3B) and Reaction Time (3C) for children and adults. Fill (white/black) represents children’s hearing status. (Note that there were no hearing adult signers in our sample).

