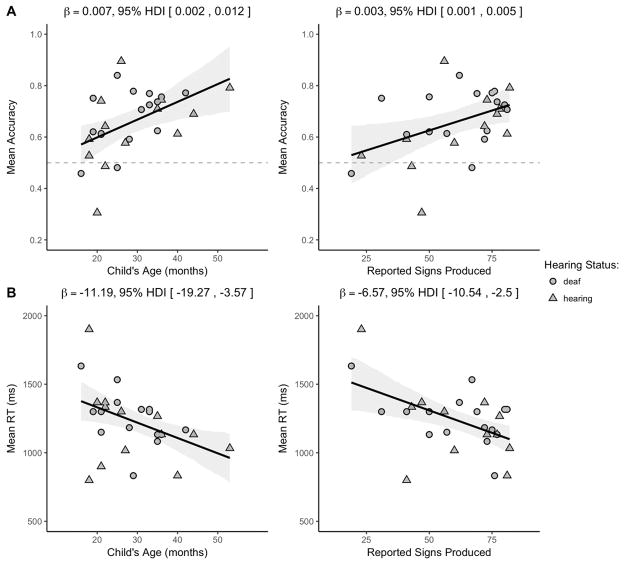
Figure 4.
Scatterplots of relations between children’s age and vocabulary and measures of their mean accuracy (4A) and mean RT (4B) in the VLP procedure. Shape represents children’s hearing status. The solid black line is the maximum a posteriori model estimate for the mean accuracy at each age point. The shaded gray regions represent the 95% Highest Density Interval (range of plausible values) around the regression line.

