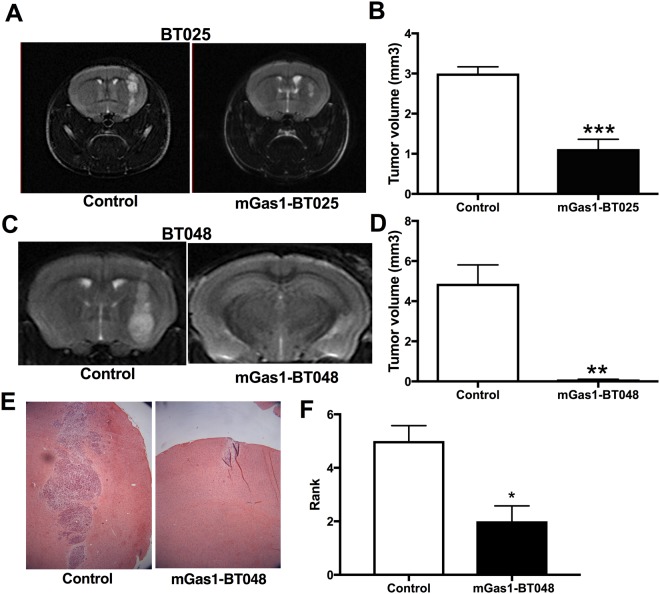
Figure 3.
Reduced tumor growth in mice implanted with mGas1-BTICs. (A) MRI images at 7 weeks post-implantation (on day 50) showed very large tumor growth in control mice implanted with BT025, whereas in mGas1-BT025 mice the tumor was significantly smaller (quantitation shown in B). Similar results were documented for mice implanted with BT048 (MRI performed on day 70; C,D) that the mice were engrafted with tumor cells was verified by the mice dying at later periods (see Fig. 4B). **p < 0.01, ***p < 0.001 with unpaired t-test (n = 5 for BT025 cells, and n = 4 for BT048 cells; error bar indicates sem). (E) In mice killed (n = 3 in each group) immediately after MRI, H&E staining showed massive tumor growth in a representative control (BT048) mouse which was barely evident in a representative mGas1-BT048 animal. Rank order analysis (F), where the higher number depicts a larger tumor area. *p < 0.05 (Mann-Whitney U test).

