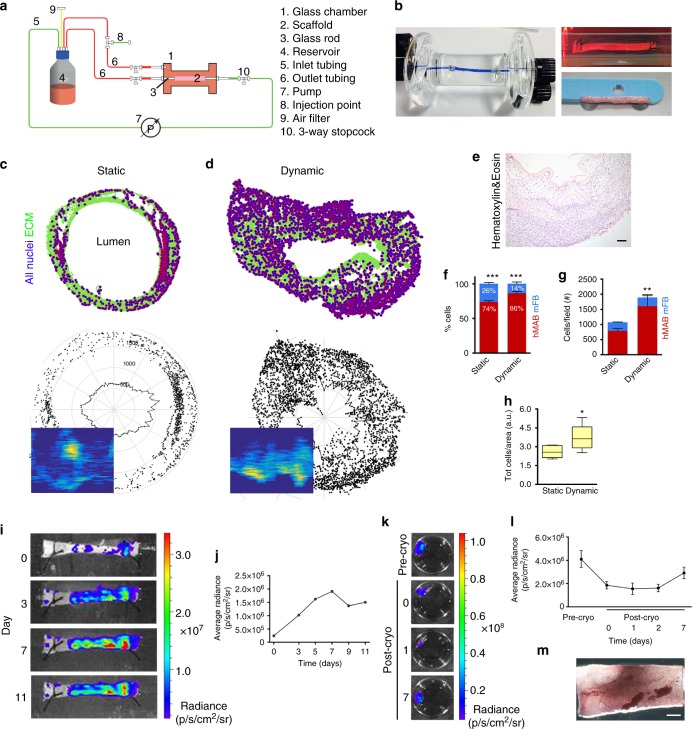
Fig. 2.
Decellularized scaffolds seeded with hMAB + mFB: static vs. dynamic culture and cryopreservation. a Simplified schematic of the bioreactor used for dynamic culture. b Photo of the glass chamber used for dynamic culture showing a decellularized oesophageal scaffold sutured between the 2 glass rods (left). Blue dye was used to highlight separation between the luminal and external compartments. Picture of a representative scaffold, seeded with hMAB + mFB, during culture in the glass chamber in dynamic conditions (top right) and at the end of the culture (bottom right). c, d Cell distribution maps, polar distribution maps and cell density maps obtained from DAPI-stained sections of a representative scaffold seeded with hMAB + mFB and cultured in static (c) or dynamic (d) conditions for 11 days. e Hematoxylin and eosin staining of a representative section of a decellularized scaffold seeded with hMAB + mFB and cultured in dynamic conditions for 11 days. Scale bar: 100 µm. f Proportion of hMAB and mFB in co-seeded scaffolds after 11 days of culture in static or dynamic conditions. Data: mean ± SEM (n = 3–6; ***p < 0.0001 hMAB vs mFB; t-test). g Total number of cells per field identified in sections of recellularized scaffolds stained for hNuclei and DAPI, with proportion of hMAB and mFB in static and dynamic-cultured scaffolds. Data: mean ± SEM (n = 6–11; technical replicates; **p = 0.0077 static vs dynamic; 2-way ANOVA). h Total number of cells per area in scaffolds recellularized with hMAB + mFB for 11 days expressed as 25th to 75th percentile, median and min to max whiskers (n = 6–14; technical replicates; *p = 0.0116; t-test). i Bioluminescence images of a representative scaffold seeded with Luc+ZsGreen+hMAB + mFB and cultured in dynamic conditions for 11 days. j Graph of the average radiance measured at different time points. k Bioluminescence images of a representative scaffold seeded with Luc+ZsGreen+hMAB + mFB and cultured in static for 8 days (pre-cryo) and for further 7 days after 2 weeks of cryopreservation. l Average radiance detected before and after cryopreservation at different time points. Data: mean ± SEM (n = 3). m Representative image of MTT colorimetric assay performed on a seeded-scaffold following cryopreservation. Scale bar: 1 mm

