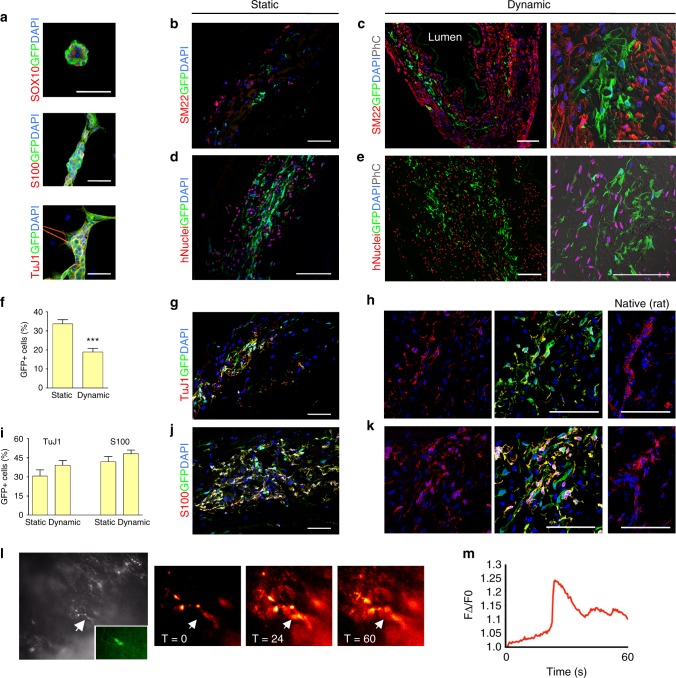
Fig. 4.
Characterization of mNCC and co-seeding with hMAB and mFB in decellularized scaffolds. a Characterization of mNCC isolated from Wnt1-cre;Rosa26YFP/YFP murine gut and expanded in culture as neurospheres. Immunofluorescence staining for SOX10, S100 and TuJ1 and epifluorescence for GFP. Nuclei were stained with DAPI. Scale bar: 50 µm. b–e Representative images of immunofluorescence for SM22, GFP and DAPI (b, c) and hNuclei, GFP and DAPI (d, e) (with phase contrast - PhC) in sections of scaffolds seeded with hMAB + mFB + mNCC and cultured in static and dynamic conditions for 11 days. Scale bar: 100 µm. f Percentage of GFP+ cells per field identified in sections of static and dynamic-cultured scaffolds. Data: mean ± SEM (n = 12–16; technical replicates; ***p < 0.0001 static vs dynamic; t-test). g–k Representative images of immunofluorescence for S100 and GFP or TuJ1 and GFP in sections of static and dynamic-cultured scaffolds. Native rat oesophagus was used as comparison (right). Nuclei were stained with DAPI. Scale bar: 100 µm. i Percentage of TuJ1+GFP+ and S100+GFP+ cells per field identified in sections of static and dynamic-cultured scaffolds. Data: mean ± SEM (n = 12–16; technical replicates). l Epifluorescence in black and white and in green (inlet) (left) and Ca2+ imaging at different time points (sec) (right) of a mNCC cell (arrow) identified on the surface of a representative scaffold after 11 days of dynamic culture. m Calcium transient plot

