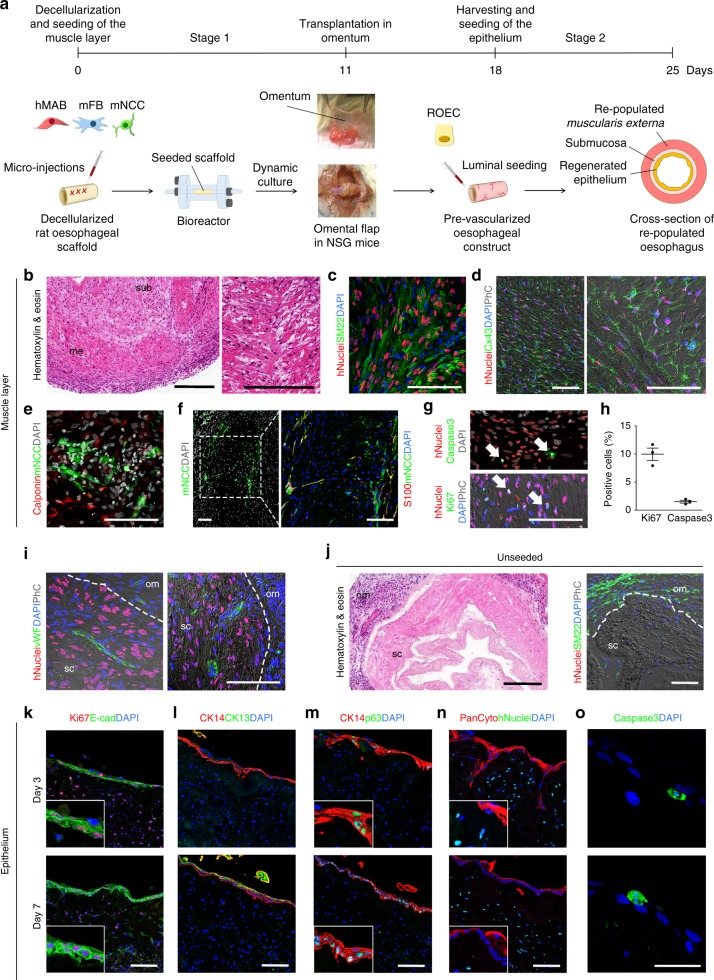
Fig. 6.
Two-stage re-population process: muscle maturation, pre-vascularization in vivo and restoration of epithelium. a Schematic of the two-stage re-population process. b–h Analysis of scaffolds seeded with hMAB + mFB + mNCC, cultured in dynamic conditions for 11 days, implanted in the omentum of NSG mice and harvested after 7 days. All images show the muscularis externa of the re-populated scaffolds. b Hematoxylin and eosin staining. Sub: submucosa; me: muscularis externa. Scale bar: 250 µm. c Immunofluorescence staining for hNuclei, SM22 and DAPI. Scale bar: 100 µm. d Immunofluorescence staining for hNuclei, Connexin43 and DAPI (with phase contrast). Scale bar: 100 µm. e Immunofluorescence staining for Calponin, GFP (indicating the mNCC) and DAPI. Scale bar: 100 µm. f Immunofluorescence staining for GFP (indicating the mNCC), S100 and DAPI. Scale bar: 100 µm. g Immunofluorescence staining for hNuclei, caspase3 and DAPI (top) and hNuclei, Ki67 and DAPI (with phase contrast) (bottom). Arrows indicate cells positive for caspase3 or Ki67. Scale bar: 100 µm. h Percentage of Ki67+ and caspase3+ cells per field identified in the muscle layer of multiple sections of recellularized scaffolds after omental transplantation. Data: mean ± SEM (n = 3). i Immunofluorescence staining for hNuclei, vWF and DAPI (with phase contrast). Sc: scaffold; om: omentum; dotted line indicates the separation border between omentum and scaffold. Scale bar: 100 µm. j Images of control (unseeded) scaffolds 7 days after implantation in the omentum. Hematoxylin and eosin staining (left – scale bar: 250 µm) and immunostaining for hNuclei, SM22 and DAPI (with phase contrast) (right – scale bar: 100 µm). Sc: scaffold; om: omentum; dotted line indicates the border between omentum and scaffold. k–o Representative images of scaffolds seeded with hMAB + mFB + mNCC, cultured in dynamic conditions for 11 days, implanted in the omentum of NSG mice, harvested after 7 days and re-populated with ROEC seeded on the luminal side. Scaffolds were analysed at 3 and 7 days of culture. Immunofluorescence for Ki67 and E-cadherin (k), CK14 and CK13 (l), CK14 and p63 (m), Pancytokeratin and hNuclei (n), and caspase3 (o). Nuclei were stained with DAPI. Insets show specificity and localization of positive cells. Scale bar: 100 µm (j, l–n) and 50 µm (k)

