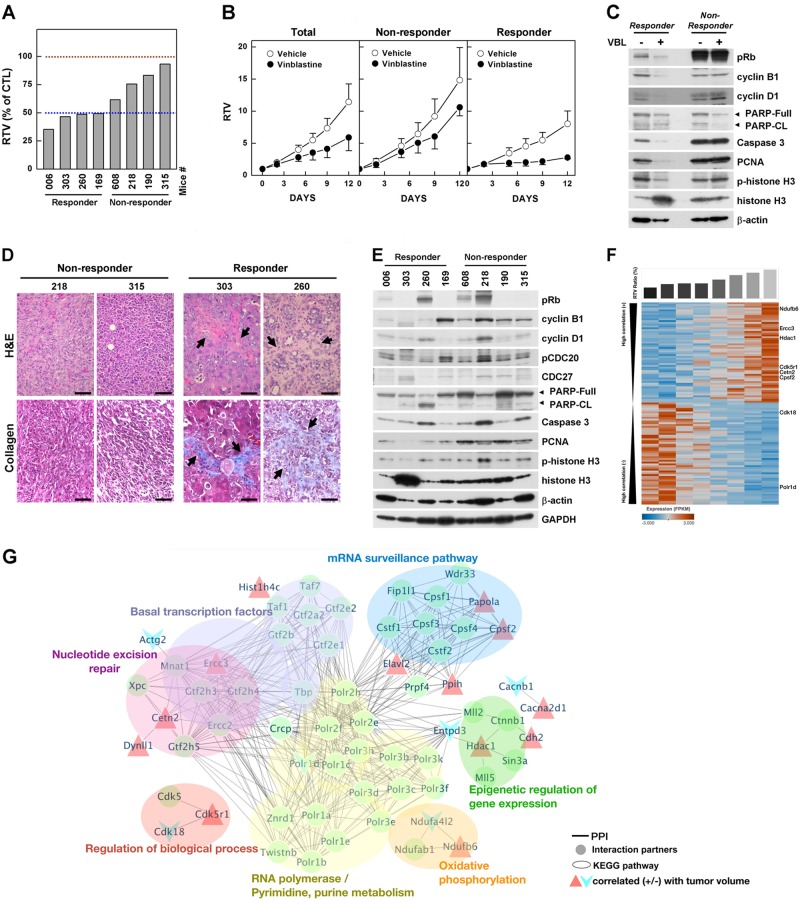
Fig. 6. Analysis of vinblastine response-associated biomarkers.
a Graph showing calculated RTVs (RTV of treated tumor/RTV of control tumor × 100) for individual tumors from mice treated with vinblastine. b Responses of BRCA1-allograft tumors to vinblastine, segregated based on the RTV (non-responder, RTV >50; responder, RTV <50). c Protein expression patterns in responder and non-responder tumors from vehicle-treated and vinblastine (VBL)-treated mice. Histone H3 and β-actin were used as loading controls. d Histological analyses of vinblastine-treated tumors from responders and non-responders are shown. The arrows indicate the stroma (upper panels) and fibrosis with collagen deposition (blue; lower panels). Scale bars: 50 μm. e Protein expression patterns in baseline tumors from responders and non-responders. Histone H3, β-actin, and GAPDH were used as loading controls. f Heat map showing downregulation and upregulation of selected genes in the vinblastine-responder group compared with the non-responder group in the allograft model; P < 0.01. Tumor samples are sorted with respect to their RTV to highlight correlations with gene expression. g Integrated functional network analysis of the selected genes using the STRING protein interaction network and KEGG pathways

