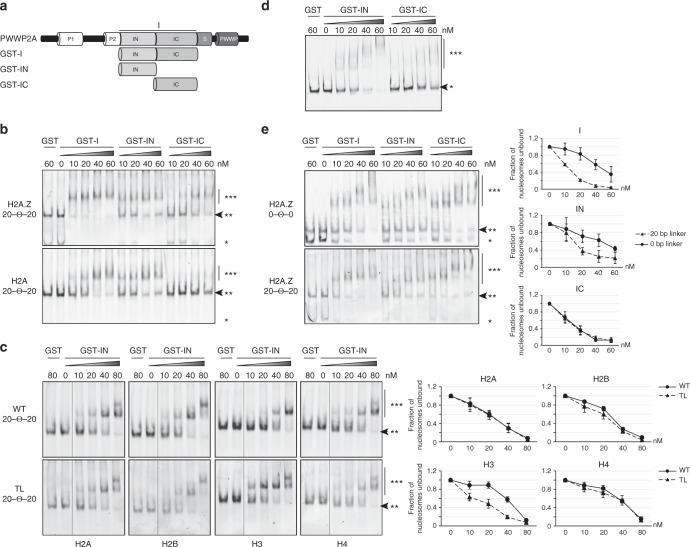
Fig. 1.
IC distinguishes between H2A and H2A.Z, whereas IN recognizes nucleosomal linker DNA. a Schematic representation of recombinant GST–PWWP2A deletions (GST-I, GST–IN, and GST-IC) used in cEMSAs. b Representative cEMSA in which a 1:1 mixture of H2A- and H2A.Z-containing nucleosomes (each with a distinct fluorescent tag) was incubated with increasing concentrations of GST-tagged I-domain constructs. The top gel shows detection of the H2A.Z nucleosomes and the bottom gel detection of the H2A nucleosomes. In both cases, the DNA contained a 20-bp linker DNA (Widom 601-sequence) on each side of the nucleosome (20–Θ–20). GST alone served as negative control. *Free DNA, **nucleosome, ***nucleosome GST–protein complex. Arrow indicates loss of signal when nucleosome GST–protein complexes are formed. c Left: representative cEMSAs similar to (b) using recombinant wildtype mononucleosomes (WT, top) or mononucleosomes lacking single histone tails (TL, bottom) containing 20-bp linker DNA (20–Θ–20). Nucleosomes were incubated with the indicated concentrations of GST–IN and the gel visualized by fluorescence detection of the indicated nucleosome. Right: quantification of signal intensities of nucleosomes (**) using Image Studio Lite Ver 5.2 (LI-COR). Error bars indicate SEM of three independent replicates. d Representative EMSA using Cy-5 labeled 187-bp dsDNA and the indicated concentrations of GST–IN and GST-IC. *free DNA, ***DNA–GST–protein complex. Arrow indicates unbound DNA. e Left: representative cEMSAs similar to (b) using recombinant H2A.Z-containing mononucleosomes without (0–Θ–0, top) and with (20–Θ–20, bottom) linker DNA; these nucleosomes were incubated with the indicated concentrations of GST-I, GST–IN, and GST-IC. *Free DNA, **nucleosome, ***nucleosome GST–protein complex. Arrow indicates loss of signal when nucleosome GST–protein complexes are formed. Right: Quantification of signal intensities of nucleosomes (**) using Image Studio Lite Ver 5.2 (LI-COR). Error bars indicate SEM of three independent replicates

