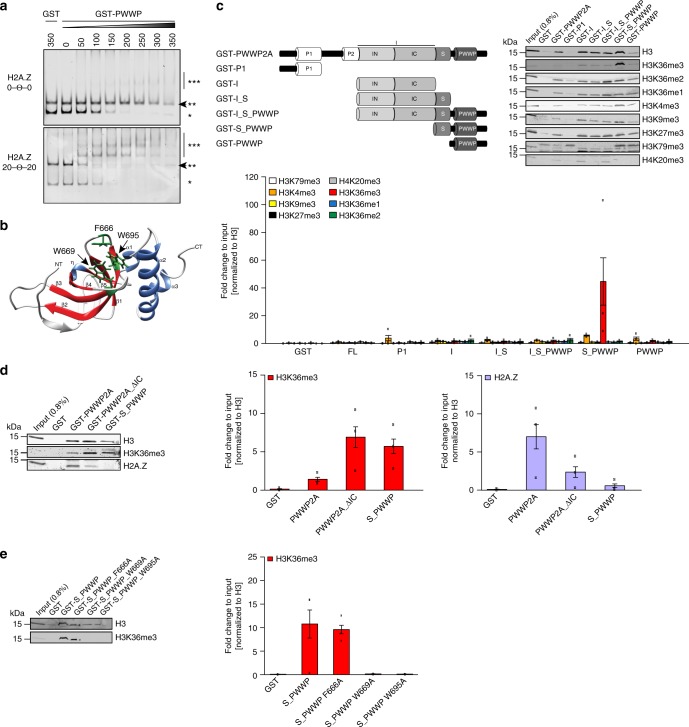
Fig. 2.
PWWP domain binds nucleic acids and S_PWWP interacts with H3K36me3. a Representative cEMSA using recombinant H2A.Z-containing mononucleosomes assembled either without (0–Θ–0, top) or with linker DNA (20–Θ–20, bottom) incubated with indicated increasing concentrations of GST–PWWP. GST alone served as negative control. *Free DNA, **nucleosome, ***nucleosome GST–PWWP complex. Arrow indicates loss of signal when nucleosome GST–protein complexes are formed. b In silico structure of PWWP domain modeled with the web browser-based tool iTASSER and visualized with Chimera (1.8.0). β-barrels (β1–β5) are colored in red, α-helixes (α1–α3), and η-helix in blue and the three residues forming the aromatic cage (F666, W669, and W695) are highlighted in green and depicted in stick mode. NT = N-terminus, CT = C-terminus. c Top left: schematic representation of recombinant GST–PWWP2A and deletions (GST-P1, GST-I, GST-I_S, GST-I_S_PWWP, GST-S_PWWP, and GST–PWWP) used in cell-derived mononucleosome-IPs. Top right: Immunoblotting of different histone PTMs upon GST–PWWP2A deletion construct (GST–PWWP2A, GST-P1, GST-I, GST-I_S, GST-I_S_PWWP, GST-S_PWWP, and GST–PWWP) IPs with HK cell-derived mononucleosomes. Notice enrichment of H3K36me3 in comparison to other modifications in S_PWWP pulldown. GST alone served as negative control. Bottom: Data quantification was done for three biological replicates for each PTM (n = 3). Data shown are means and error bars depict SEM. d Left: immunoblotting of H3K36me3 and H2A.Z upon GST–PWWP2A, GST-PWWP2A_ΔIC and GST-S_PWWP IPs with HK cell-derived mononucleosomes. Right: Data quantification of H3K36me3 enrichment (middle) and H2A.Z binding (right) was done for three biological replicates (n = 3). Data shown are means and error bars depict SEM. e Left: immunoblotting of H3K36me3 upon GST-S_PWWP aromatic cage point mutants (GST-S_PWWP_F666A, GST-S_PWWP_W669A, GST-S_PWWP_W695A) IPs with HK cell-derived mononucleosomes. Notice reduction of H3K36me3 in GST-S_PWWP_W669A and GST-S_PWWP_W695A pulldowns. Right: Data quantification was done for three biological replicates (n = 3). Data shown are means and error bars depict SEM

