Fig. 3.
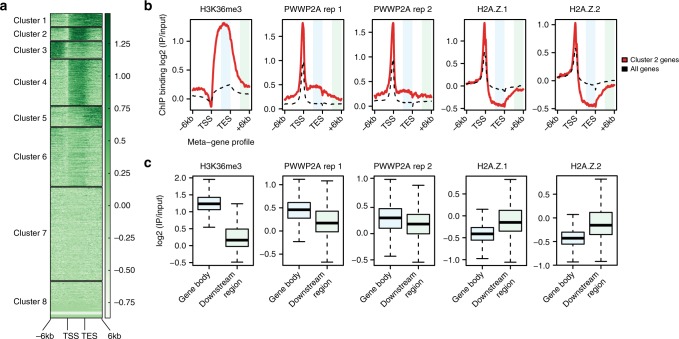
PWWP2A associates weakly with H3K36me3-enriched, H2A.Z-depleted gene body regions. a ChIP-seq density heatmap of H3K36me3 (ENCODE) clustering analysis of meta-gene binding profiles encompassing gene bodies and 6 kb upstream and downstream regions of transcriptional start sites (TSS) and transcriptional end sites (TES). Color intensity represents normalized and scaled tag counts. Cluster 2, which represents H3K36me3-enriched genes, was used for further analysis. b Meta-gene profile correlations of ChIP-seq data for H3K36me3, two GFP–PWWP2A replicates (rep), GFP-H2A.Z.1, and GFP-H2A.Z.2 mean coverage signals of cluster 2 genes (red line) and all genes (black dotted line) encompassing gene bodies and 6 kb upstream and downstream regions of TSS and TES. Regions highlighted in light blue (gene body) and light green (downstream region) were further analyzed in (c). GFP–PWWP2A and GFP-H2A.Z nChIP-seq data are from12. (c) Boxplots of H3K36me3, two independent GFP–PWWP2A, GFP-H2A.Z.1, and GFP-H2A.Z.2 signal intensities comparing gene body with non-coding regions of same size within cluster 2

