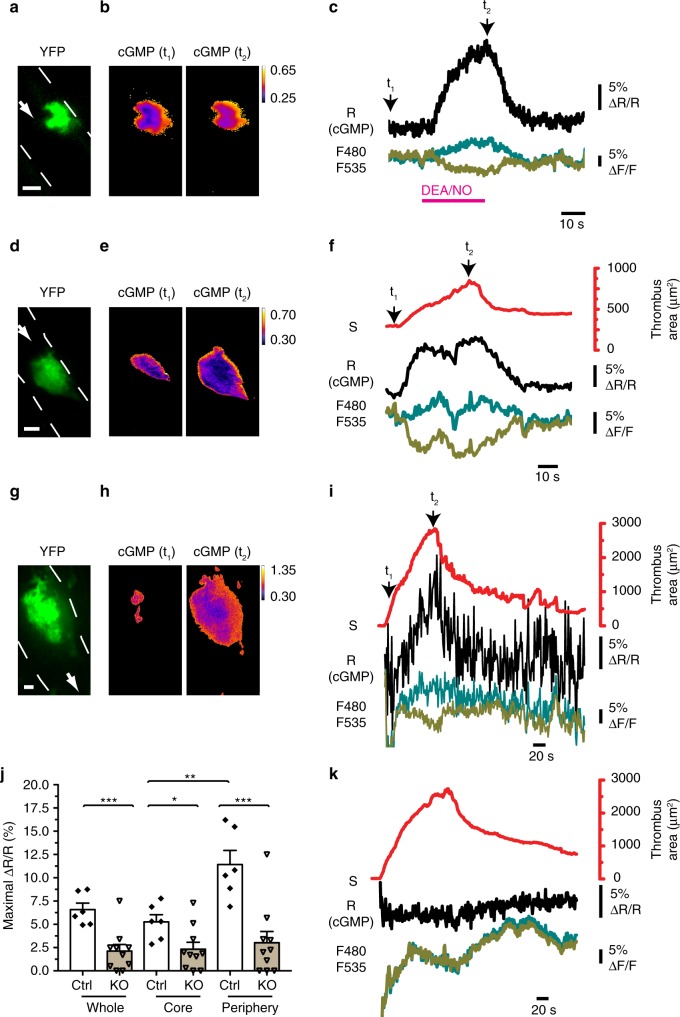
Fig. 3.
Thrombus growth is associated with dynamic changes of intraplatelet cGMP in vivo. Platelet cGMP (black traces) and thrombus growth (red traces) were visualized by intravital spinning disk FRET microscopy of cremaster arterioles. Vessel walls are outlined by broken white lines, and white arrows indicate the direction of blood flow. a–f cGMP imaging in thrombi formed in platelet-specific sensor mice (cGi500-L2fl/fl; Pf4-Cretg/+) after mechanical vessel injury. a Sensor fluorescence confirms its specific expression in platelets. b, c cGMP concentration shown by CFP/YFP emission ratio (R = F480/F535) in a stable thrombus before (t1) and after (t2) application of 10 μM DEA/NO. The cGMP level in the entire thrombus is shown in c. The signals at time point t1 and t2 correspond to the images shown in b. d–f Endogenous cGMP and thrombus area during mechanical injury-induced thrombosis. Note that no exogenous NO was applied. The cGMP level in the periphery of the thrombus is shown in f. The signals at time point t1 and t2 correspond to the images shown in e. g–k Endogenous cGMP and thrombus area during laser-induced thrombus formation. Representative results obtained with sensor control mice (cGi500-L2fl/fl; Pf4-Cretg/+; NO-GC β1+/fl) (g–i) or sensor mice with platelet-specific NO-GC β1 deficiency (cGi500-L2fl/fl; Pf4-Cretg/+; NO-GC β1fl/fl) (k) are shown. Note that no exogenous NO was applied. The signals at time point t1 and t2 (i) correspond to the images shown in h. j Evaluation of maximal FRET signal changes in the entire thrombus as well as in its core and periphery in control (Ctrl) and platelet-specific NO-GC β1 knockout (KO) mice. Data points represent individual thrombi (n = 6 and 10 respectively, mean ± SEM, *P < 0.05; **P < 0.01; ***P < 0.001; one-way ANOVA). Color calibration bars in b, e, h indicate relative cGMP concentrations. Scale bars in a, d, g 10 μm

