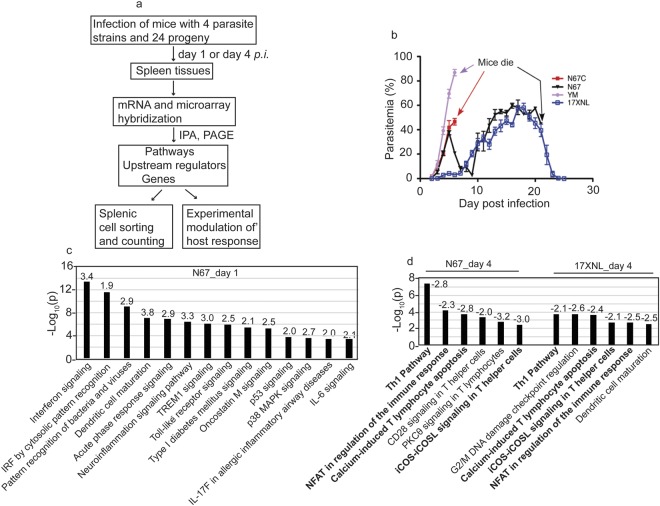
Figure 1.
Significantly enriched activated or inhibited pathways after infection with N67 or 17XNL parasites. (a) Flowchart of experimental procedures conducted for this work. The methods and experimental procedures are as described in Materials and Methods. (b) Parasitemia curves from mice infected with four Plasmodium yoelii strains/subspecies. N67C, P. y. nigeriensis N67C; N67, P. y. nigeriensis N67; YM, P. y. yoelii YM; 17XNL, P. y. yoelii 17XNL. Arrows indicate time points of host death. C57BL/6 mice were injected i.v. with 10 × 106 infected red blood cells (iRBCs) and daily parasitemia (percentage of iRBCs) were obtained after counting Giemsa stained thin blood smears. (c) Significantly enriched and activated pathways day 1 post infection with N67. The numbers on top of the bars are z-scores. A positive z-score suggests activation of a pathway. (d) Significantly and negatively enriched pathways day 4 post infection with N67 or 17XNL. The numbers on top of the bars are z-scores. A negative z-score indicates inhibition of a pathway. The pathway analyses were performed using Ingenuity Pathway Analysis (IPA).

