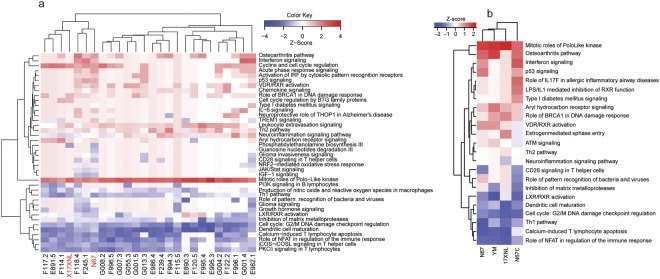
Figure 4.
Hierarchical clusters of activated or inhibited pathways in mice infected with four P. yoelii strains and 24 genetic cross progeny of the 17XNL × N67 cross. (a) Clustering pathways from mice infected with 17XNL, N67, and their 24 progeny. The two parents are highlighted in red at the bottom. Pathway names are at the right of the figure. (b) Clustering pathways from mice infected with four P. yoelii strains/subspecies (bottom). 17XNL, P. y. yoelii 17XNL; YM, P. y. yoelii YM: N67, P. y. nigeriensis N67; N67C, P. y. nigeriensis N67C. Gene expression differences between infected and uninfected mice were compared using ANOVA using a 2.0-fold cutoff value. Ingenuity Pathway Analysis (IPA, Qiagen) was used to perform pathway enrichment (p ≤ 0.001) and activation/inhibition (z-score ≥ 2.0 for activation; z-score ≤− 2.0) analyses.

