Fig. 3.
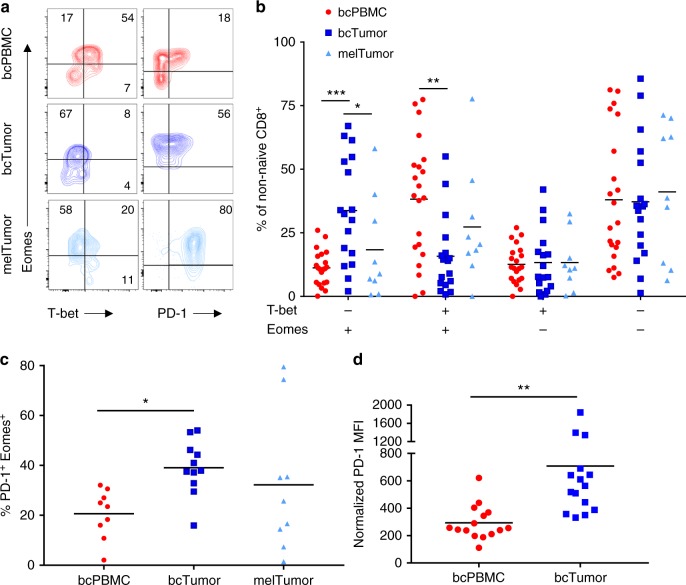
CD8+ TILs in breast tumors have elevated frequencies of PD-1+ EOMES+ cells. a CD8+ T cells from bcPBMCs, bcTumor, and melTumor were analyzed by flow cytometry for expression of T-bet, Eomes, and PD-1 as shown in representative contour plots. b Graph depicts the percentage of Eomes and T-bet expressing populations of non-naive CD8+ T cells in bcPBMCs, bcTumor, and melTumor. c Non-naive CD8+ T cells were analyzed for expression of Eomes and T-bet and gated as shown in representative contour plots. c Graph depicts the percentage of non-naive CD8+ T cells composed of PD-1+ Eomes+ cells in bcPBMCs, bcTumor, and melTumor. d Normalized values of PD-1 expression on non-naive CD8+ T cells in matching bcPBMC and bcTumor samples are shown. Each symbol represents data from a unique patient sample. Significance was calculated using one-way ANOVA and Holm–Sidak multiple comparison tests b, c or an unpaired Student's t-test (d); *p < 0.05; **p < 0.01; ***p < 0.001

