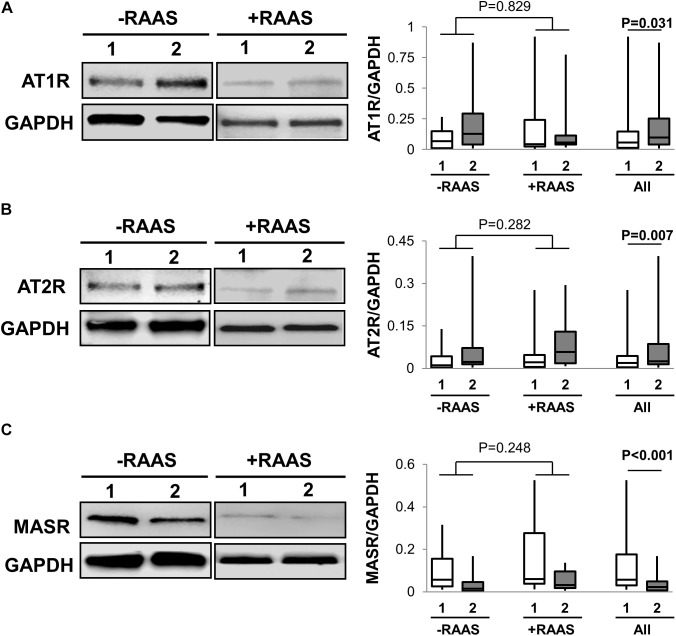
FIGURE 3.
Cellular Receptors for Angiotensin Peptides. Representative Western blots and graphs showing expression of AT1R, (A), AT2R, (B) and MASR in (C) abdominal subcutaneous (1, white bars) and visceral (2, gray bars) fat depots. Data are presented as median and interquartile range. Fiskars depict minimum and maximum values. –RAAS: data from AT of subjects not taking any RAAS related drugs; +RAAS: data from AT of individuals taking RAAS targeted drugs. P-values were determined using repeated ANOVA.

