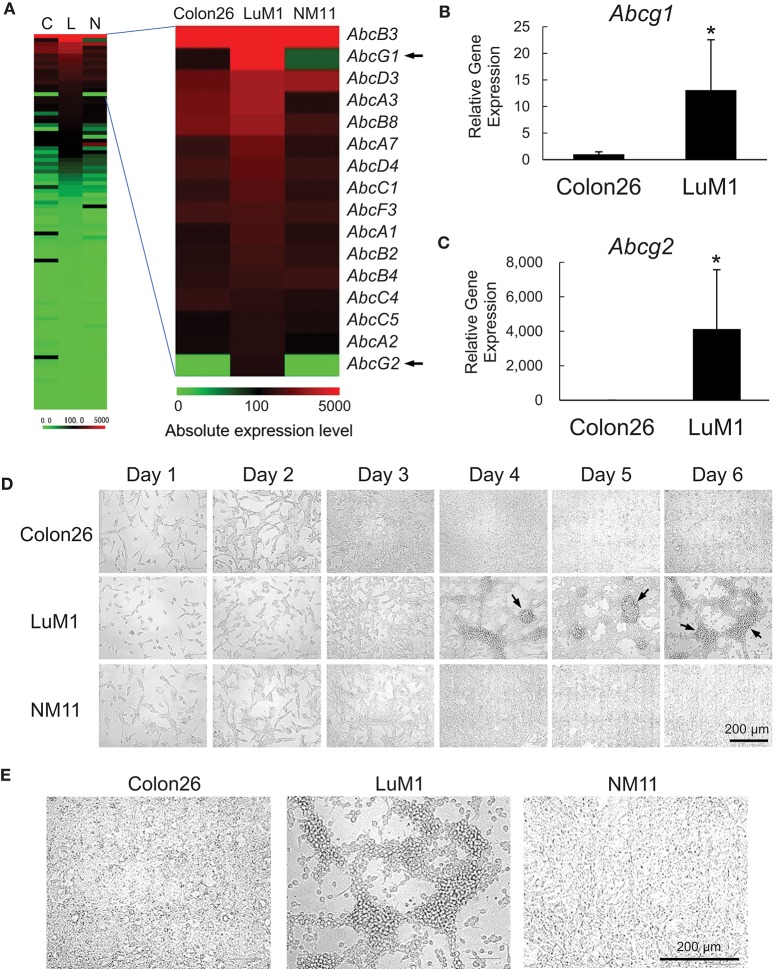
Figure 1.
Transcriptome and morphologies of colon cancer cells with different metastatic potentials. (A) Heat map analysis of absolute expression levels of ABC genes. Left, all ABC genes. Right, top 16 ABC genes expressed in LuM1 cells. C, Colon26; L, LuM1, N, NM11. (B,C) Relative mRNA levels of Abcg1 (B) and Abcg2 (C) analyzed using RT-qPCR. n = 4, biological replicates. *p < 0.05 (Mann-Whitney test). The mRNA levels were normalized with the levels of an internal control Hprt1. (D,E) Representative photomicrographs of LuM1, NM11, and Colon26 cells at day 1 to day 6 (D) and day 4 (E) post-seeding period. Cells were cultured in a serum-containing medium on 2D culture plates. Scale bar, 200 μm. Arrows indicate cellular aggregates. Enlarged images of cells at day 4 was shown in (E).

