Figure 4.
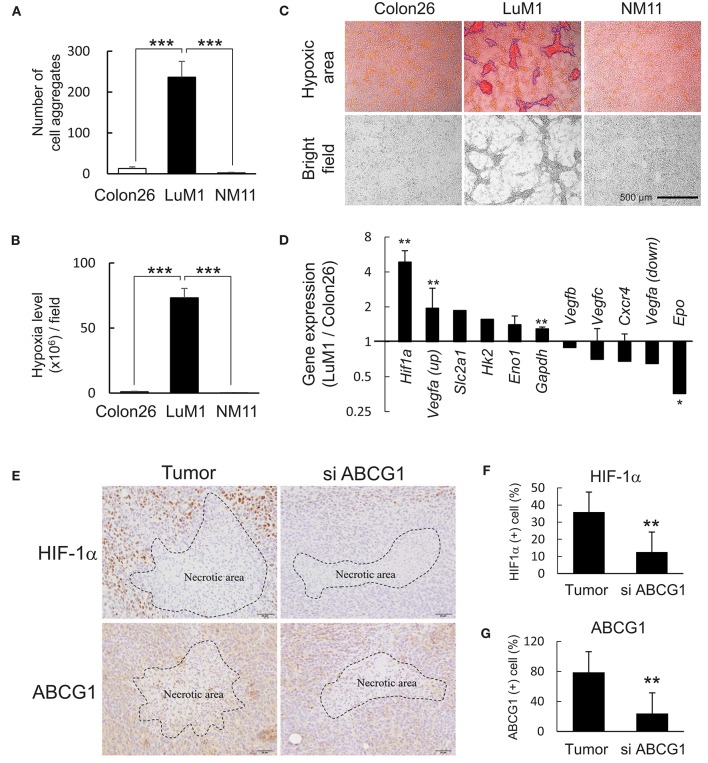
Depletion of ABCG1 declined HIF-1α level in tumors. (A,B) Differential abilities to form hypoxic aggregates (A) and hypoxia levels (B) of LuM1, Colon26, and NM11. ***P < 0.0001 (vs. LuM1), n = 4. Similar data were obtained from 10 independent experiments. The number of aggregates per a well in a 96-well plate was shown in (A). (C) Representative images of hypoxic aggregates. Top, merged images of hypoxia probe signal (red and orange areas) and bright fields. Fluorescent hypoxic areas greater than 300 μm2 were enclosed with blue lines and counted as hypoxic cell aggregates. Bottom, bright fields. Scale bar, 500 μm. (D) Expression profile of hypoxia-related genes (LuM1 vs. Colon26). mRNA levels of Hif1a and its target genes in LuM1 cells were divided by those in Colon26 cells. **P < 0.01, *P < 0.05. Hif1a, n = 3; Eno1, n = 3; Gapdh, n = 7; Vegfc, n = 3; Cxcr4, n = 2; Vegfa up, n = 2; Vegfa down, n = 2; Epo, n = 2 (number of probes used in microarray). (E) Representative immunohistochemistry showing HIF-1α and ABCG1 in tumor central area at day 22 post-injection period. Necrotic areas were enclosed with dotted lines. Scale bars, 50 μm. (F,G) positivity rates of HIF-1α (F) and ABCG1 (G) around the necrotic areas in ABCG1-depleted or control tumors. **P < 0.01, n = 5.

