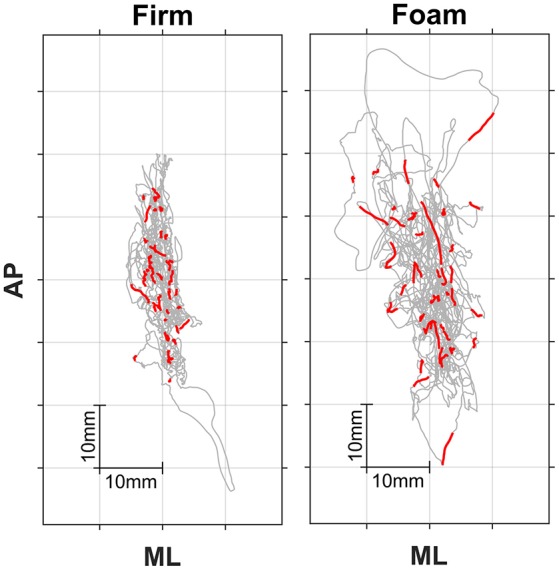
Figure 1.

Posturograms for firm (Left) and foam (Right) surface conditions. Trials lasted 181 s. Anterior-posterior (AP) vs. mediolateral (ML) center-of-pressure trajectories are depicted in gray, while superimposed red traces represent the 42 or so stimulus-response episodes during a trial.
