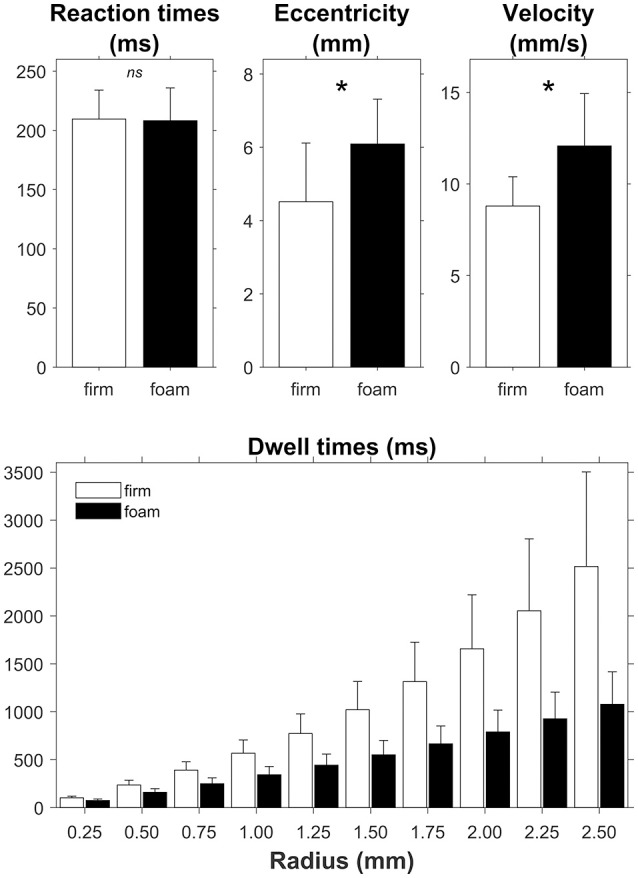
Figure 3.

Effect of support surface (firm, white bars and foam, black bars) on reaction times and the global posturographic outcomes eccentricity, velocity and dwell times, the latter presented for a range of radius values. Error bars represent standard deviations. Asterisks in the top panels denote a significant difference between firm and foam conditions. The difference between firm and foam was significant across all radii (bottom panel).
