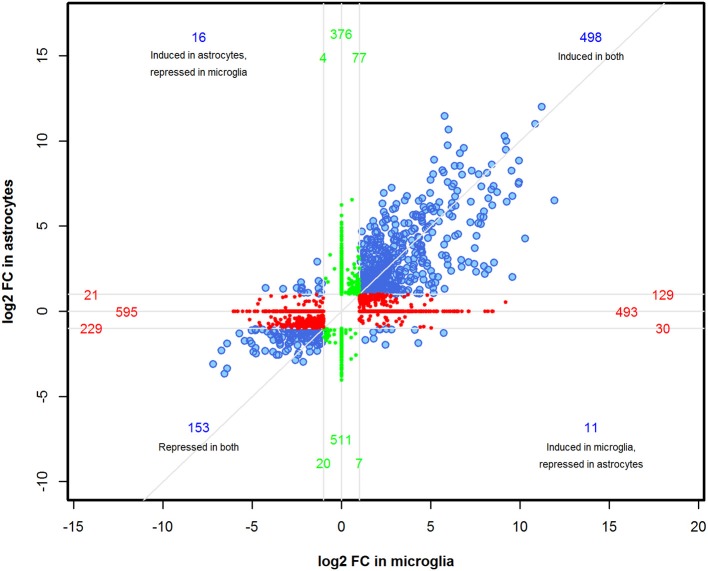
Figure 3.
Identification of distinct transcriptional changes induced by Th1-derived effectors in microglia and astrocytes. A four-way plot was generated using 3170 DEGs enriched between microglia and astrocytes based on fold changes ≥2.0 and a false discovery rate of 0.01 (corrected p < 0.01) selection criteria. FC value was adjusted to 1 for those genes where corrected p > 0.05 in either of the cell type. log2 (fold change) values of astrocytes was plotted against microglia. Blue dots represent common regulated genes, red dots are genes more specifically regulated in microglia and the green dots indicate astrocyte specific genes.

