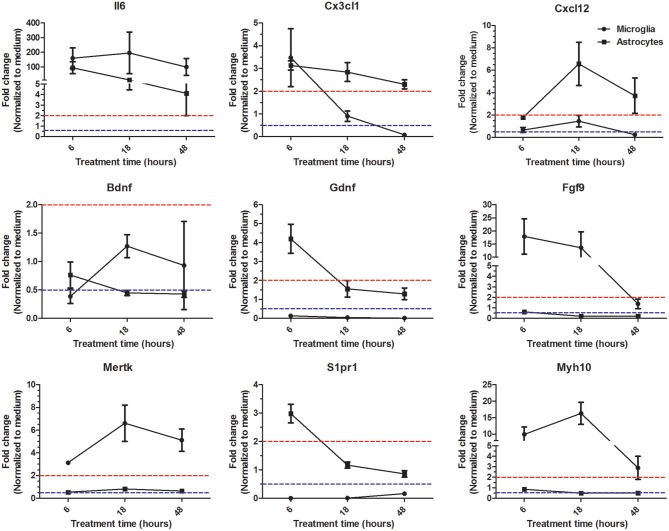
Figure 5.
Expression kinetics of genes identified as specifically regulated in microglia and astrocytes. Microglia and astrocytes were treated with Th1 culture supernatants for 6, 18, and 48 h. Expression of given genes was analyzed by RT-PCR. Results are represented as fold changes normalized to respective medium controls. Data above dashed red line indicate upregulation >2-fold and the data below dashed blue line indicate downregulation >2-fold. The data form four independent experiments (n = 4) is represented as mean ± SD.

