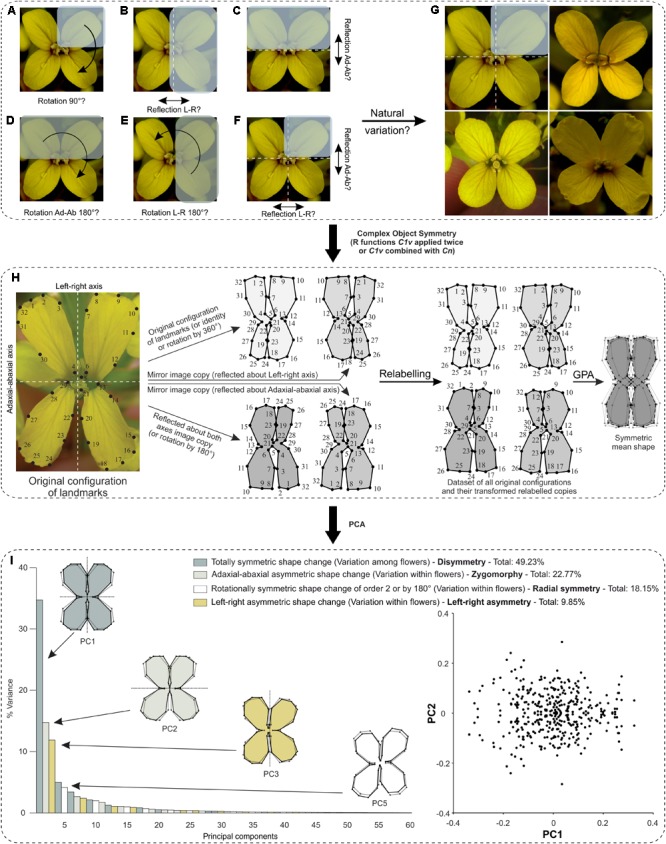
FIGURE 6.

What is the biological repeated unit of interest in complex floral symmetry and how one should determine it? The case of E. mediohispanicum as an example. (A–F) Crucifers are symmetric with respect to two perpendicular axes of symmetry and several interpretations are possible concerning the identification of floral module(s) that generate the symmetry group of interest (indicated in parentheses). (A) Rotations by 90° (C4). (B) Reflection about the vertical left–right axis of either Adaxial-abaxial right or left petals (C1v). (C) Reflection about the horizontal adaxial–abaxial axis of either adaxial left–right petals or their abaxial equivalent (C1h). (D) Rotation by 180° about the centre of the flower of adaxial left–right petals or their abaxial (C2). (E) Rotation by 180° about the centre of the flower of adaxial–abaxial right petals or their left counterparts (C2). (F) Reflection combined with rotations by 180° (C2v). (G) The correct symmetry group was determined according to the well-known and in depth study of natural variation occurring in this flower which exhibits a wide range of different types of symmetry and corresponds to (F). (H,I) Workflow for shape analysis of E. mediohispanicum flowers with two perpendicular axes of bilateral symmetry or bilateral symmetry combined with rotational symmetry of order 2 (by 180°) (case study 2). Credit: photograph courtesy of J. M. Gómez (Universidad de Granada, Spain). (H) First, an original configuration is considered, then all transformed relabelled copies in the symmetry group are produced either with function ‘C1v’ applied twice or after combining functions ‘C1v’ and ‘Cn.’ A GPA is applied to this dataset. The mean shape (consensus) is symmetric. (I) A PCA unambiguously separates the four components of shape variation and indicates how much their associated PCs account for the total variance. The first PC of each component is displayed. The outline wireframes of flowers show shape changes associated with each PC from the overall average shape (gray outline and open circles) for PC1 scores of –0.1 and +0.1, and for PC2 scores of –0.1 and +0.1 (solid black outline with coloured background and solid black circles). A scatterplot of the PC scores for PC1 and PC2 shows a distribution that is symmetric under reflection only. Each point in the plot corresponds to transformed copies of a given flower’s configuration of landmarks.
