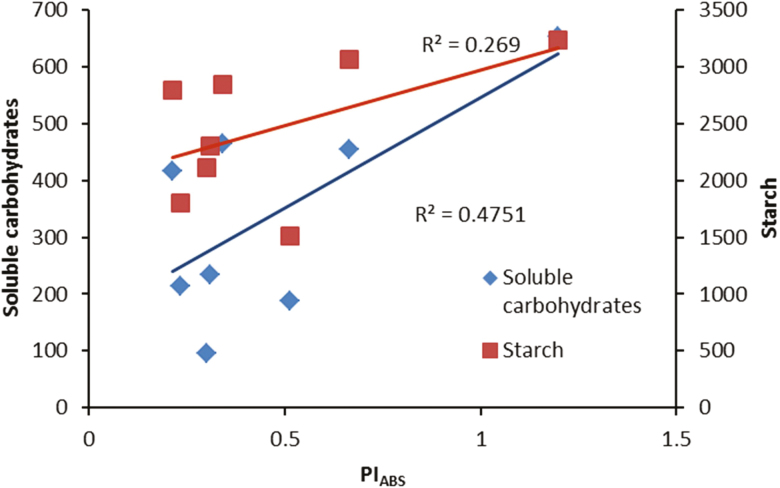
Figure 10.
Relationship between performance index on the absorption basis (PIABS) and concentration of carbohydrates (soluble carbohydrates and starch) in the leaves of rose plants grown under different light spectra [blue (B), red (R), white (W) and red and blue (RB)] under 250 (C) and 1500 (HL) µmol m−2 s−1 PPFD.

