
FIGURE 1.
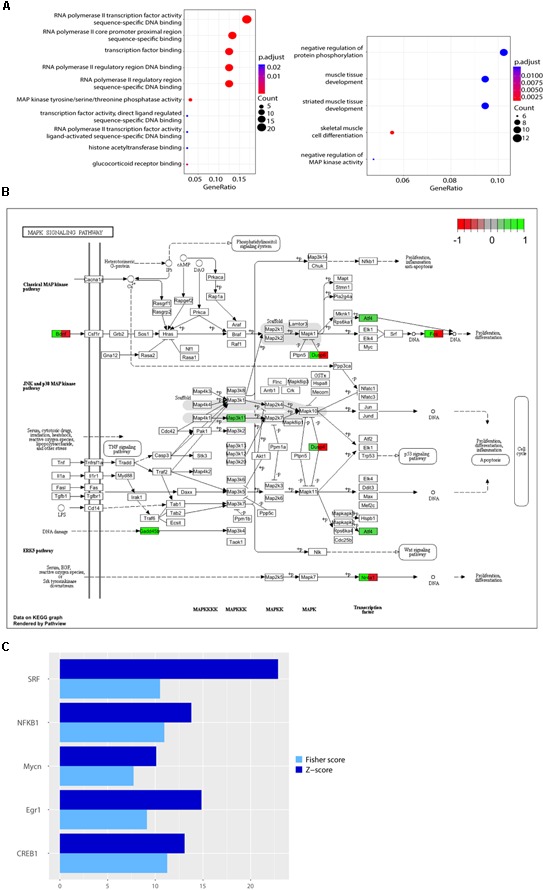
Functional analysis of genes differentially expressed in response to L-lactate after 1 h. (A) GO plots showing enrichment of biological processes and molecular functions for the genes differentially expressed after 1 h stimulation with L-lactate (135 genes, q-value < 0.1, three biological replicates, n = 3 independent cultures). Statistical significance for the enriched terms is based on the multiple testing-corrected p-value, which is color-coded. The number of genes associated with each respective term is indicated by the dot size. (B) A detailed KEGG graph of the MAPK signaling pathway with genes modulated by L-lactate at 1 h highlighted in green indicating that they are up-regulated. Dusp10 and Gadd45g are not indicated on the pathway map. Genes highlighted in red are genes down-regulated in the co-treatment condition with MK801 and L-lactate. (C) Bar plot showing fold enrichment of specific transcription factor binding sites in the promoters of genes modulated by L-lactate at 1 h (FDR < 0.001). Z-score is the main enrichment indicator and is obtained by dividing the rate of occurrence of a TFBS in the target set of genes to the expected rate estimated from the pre-computed background. The Fisher score is calculated as the negative natural logarithm of the one-tailed Fisher exact probability.