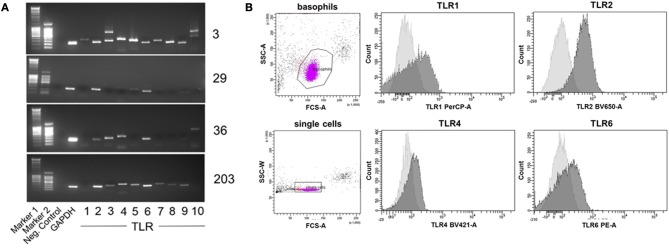
Figure 7.
Individual TLR expression on human basophils as assessed by RT-PCR and surface staining followed by flow cytometry. (A) Expression of TLR1−10 cDNA as assessed by RT-PCR of four individual donors shown as an example for distinct expression patterns. The full set of donors are listed in Table 2. (B) Expression of the surface-exposed TLR1, 2, 4, and 6 on basophils of donor 29 measured by flow cytometry. Depicted are the histogram overlays of unstained (light gray) and with the respective fluorescently-labeled antibody stained (dark gray) basophils.

