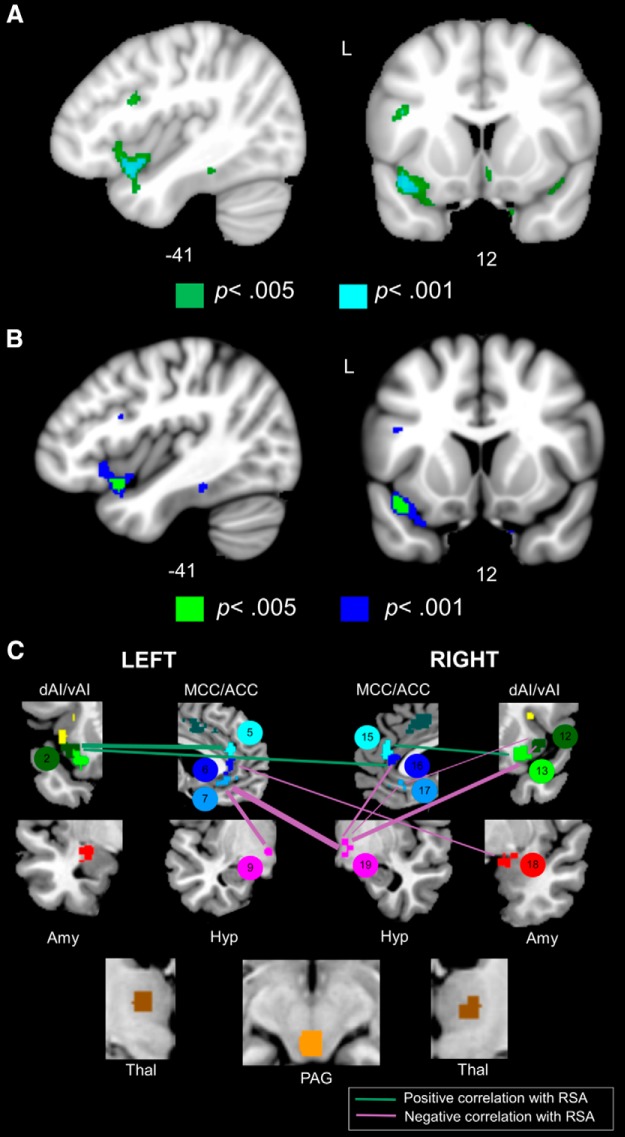
Figure 2.
Baseline PANS activity is determined by the strength of certain salience network connections and the suppression of others. A, Atrophy in left vAI was associated with lower RSA at p < 0.001, uncorrected (controlling for age, sex, and education) in 21 patients with bvFTD. Cyan represents T scores at p < 0.001, uncorrected (T > 3.69). Green represents T scores at p < 0.005, uncorrected (T > 2.92). B, We conducted a follow-up VBM analysis of RSA in which we added SCL as an additional covariate to the model. The results remained largely unchanged, although some weaker clusters no longer remained significant. Cyan represents T scores at p < 0.001, uncorrected (T > 3.79). Green represents T scores at p < 0.005, uncorrected (T > 2.98). C, The fMRI analyses revealed that lower baseline PANS activity was associated with lower vFI-ACC connectivity and higher connectivity primarily in ACC-hypothalamus/amygdala. Line thickness is scaled to reflect the percentage of variance that each edge explained (i.e., R2 change, which ranged from 0.06 to 0.30) in the hierarchical regression model. Statistical maps are superimposed on the MNI template brain.

