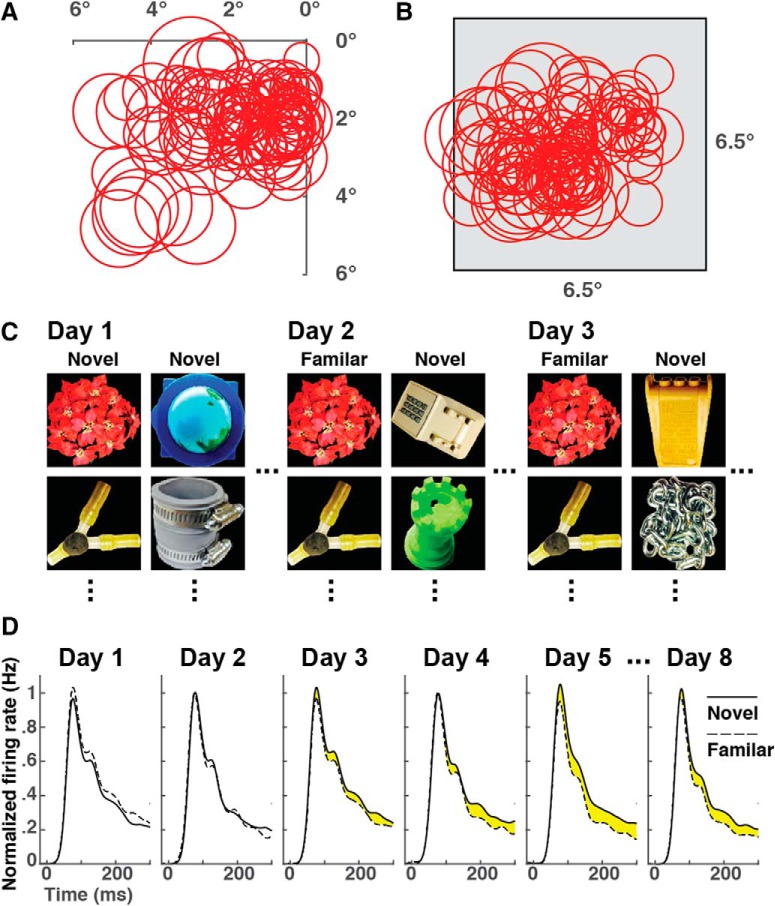
Figure 1.
Experimental design. A, Receptive fields of area V2 neurons from all six experiments superimposed on a map of the inferior contralateral visual field. Receptive fields from Experiment 6, the only experiment involving the left hemisphere, are mirror-reflected across the vertical meridian. B, The same receptive fields are shown in relation to the image frame. Their relative arrangement is altered because the location of the frame was shifted at the beginning of each experiment so as to center it on currently recorded neuronal receptive fields. C, On each exposure day, the monkey viewed 25 images from a familiarization set that remained the same throughout the experiment. On most exposure days, the monkey also viewed 25 images from a session-unique novel set. D, Example from Experiment 2. Familiarity suppression was first evident on Day 3 and persisted thereafter until the end of the experiment on Day 8. Yellow fill indicates suppression of the familiar-image response (dashed curve) relative to the novel-image response (solid curve) for each day on which the effect was statistically significant (p < 0.05, signed rank test, with number of observations in each category equal to number of neurons recorded during the session). Each curve represents the instantaneous population firing rate as averaged across all V2 neurons recorded on the indicated day for all images in a given category (25 familiar images or 25 novel images). Smoothing was accomplished by convolution with a Gaussian kernel a 10 ms SD. Firing rates on each day were normalized according to the formula R′ = (R − B)/(P − B) where B was the baseline firing rate at time 0 and P was the peak firing rate, with both measures based on mean population activity in data combined across novel-image and familiar-image trials.

