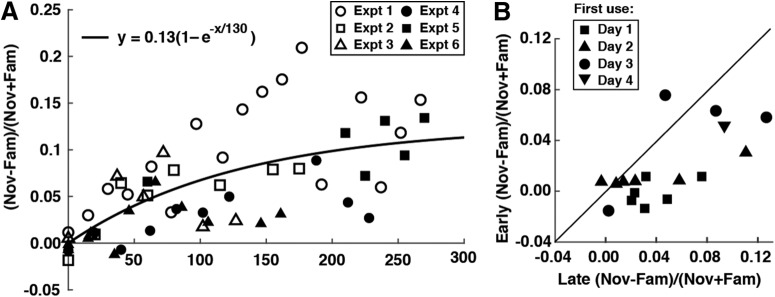
Figure 2.
Development of familiarity suppression. A, Familiarity suppression developed as a saturating monotonic function of the number of prior exposures to the images in the repeating set. This graph plots familiarity suppression as a function of the number of times the monkey had seen each image in the familiarization set before the recording day. Each point represents results from one recording day in one experiment. The six symbols represent six experiments as identified in the inset. The index of familiarity suppression was (Nov − Fam)/(Nov + Fam) where Nov was the population mean firing rate elicited by novel images and Fam was the population mean firing rate elicited by familiar images, with both measures based on an epoch 120–540 ms after image onset. The curve and formula represent the best-fit zero-intercept exponential function. B, Familiarity suppression was independent of the accidental properties of the images as indicated by the outcome of 17 repeated-novel sessions (Table 1, row 12). In these sessions, we recorded neuronal responses late in the experiment (Day 7–22) to 25 images in the familiar set and 25 images in a novel set previously used early in the experiment (Day 1–4). For each of the 17 cases, we plot the index of familiarity suppression obtained during the early session against the index of familiarity suppression obtained during the late session. Symbols indicate the training day on which the first use of the novel image set occurred. Points below the identity line derive from 11/13 tests in Monkey L and 4/4 tests in Monkey G.

