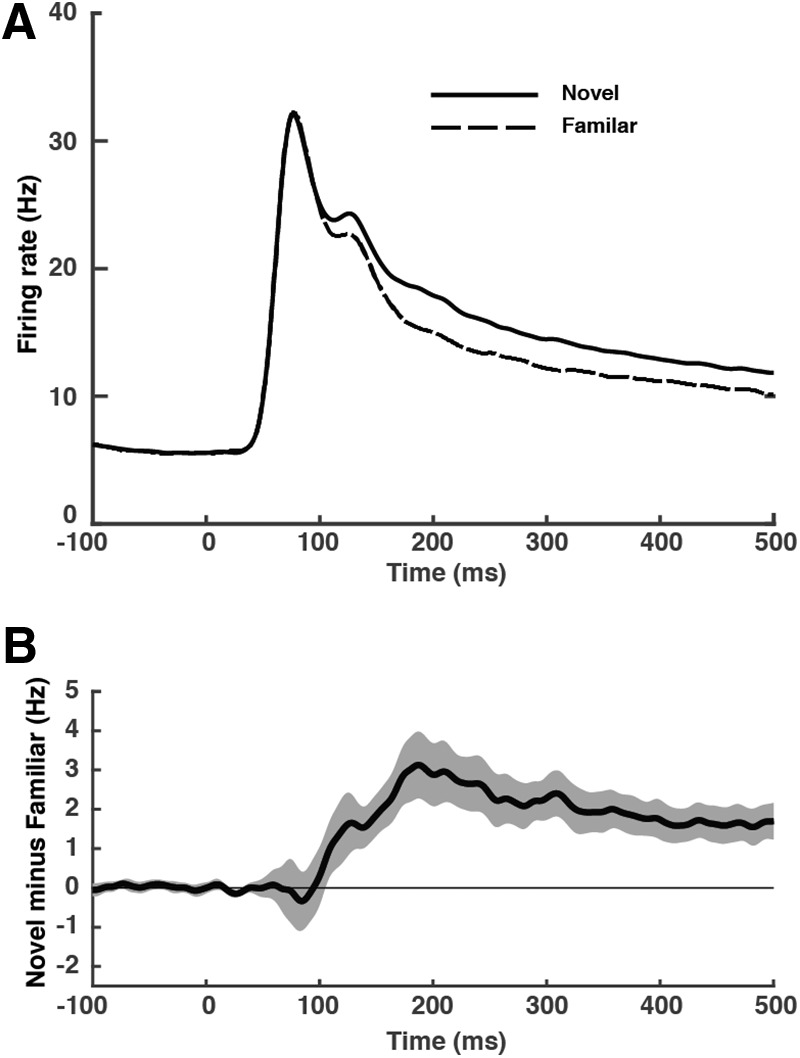
Figure 3.

Latency of familiarity suppression. A, Population mean firing rate as a function of time following image-onset during 46 sessions in which familiarity suppression was demonstrably present (Table 1, row 7). Solid and dashed curves indicate responses to familiar and novel images, respectively. B, Difference in firing rate between novel-image trials and familiar-image trials as a function of time following stimulus onset. Ribbons indicate SEM. Curves in A and B were smoothed by convolution with a Gaussian function with a 5 ms SD.
