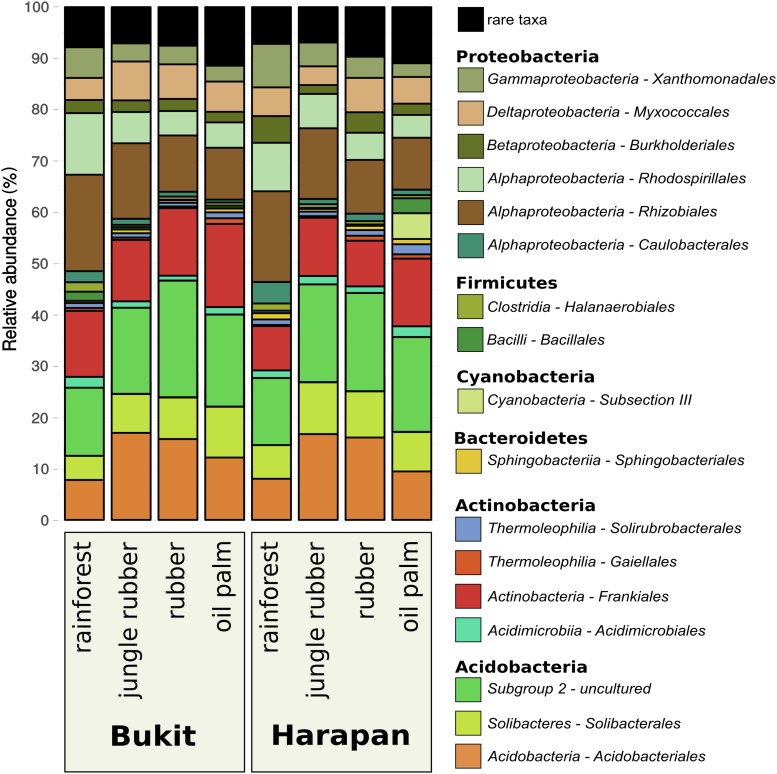
FIGURE 2.
Community composition of active soil bacterial communities in three different land use systems and rainforest reference sites in two different landscapes. All plots were clustered according to their respective land use and landscape. Community compositions are displayed as relative abundances at order level based on 16S rRNA sequences obtained from extracted soil RNA. Taxa with abundances below 1% in each land use system were summarized as “rare taxa.” The detected orders are grouped to corresponding phylum (for details see Supplementary Table S2).

