
FIGURE 4.
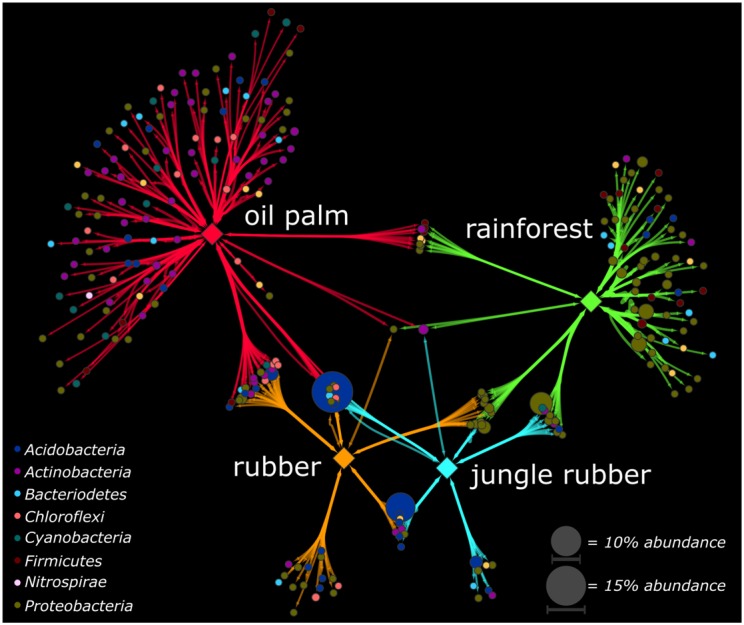
Association networks based on the point biserial correlation coefficient of genera related to the analyzed land use systems. Analyzed land use systems are displayed as hub nodes, while bacterial genera are displayed as nodes. Edges represent the point biserial correlation coefficient. Size of nodes and intensity of edges contribute to average abundance of genera in all land uses and weight of the respective point biserial correlation coefficient, respectively. Color of nodes contributes to prominent bacterial phyla. Hub nodes and edges are colored according to analyzed land use systems rainforest, jungle rubber, rubber, and oil palm. Only significant associations were included in the analysis (p < 0.05).