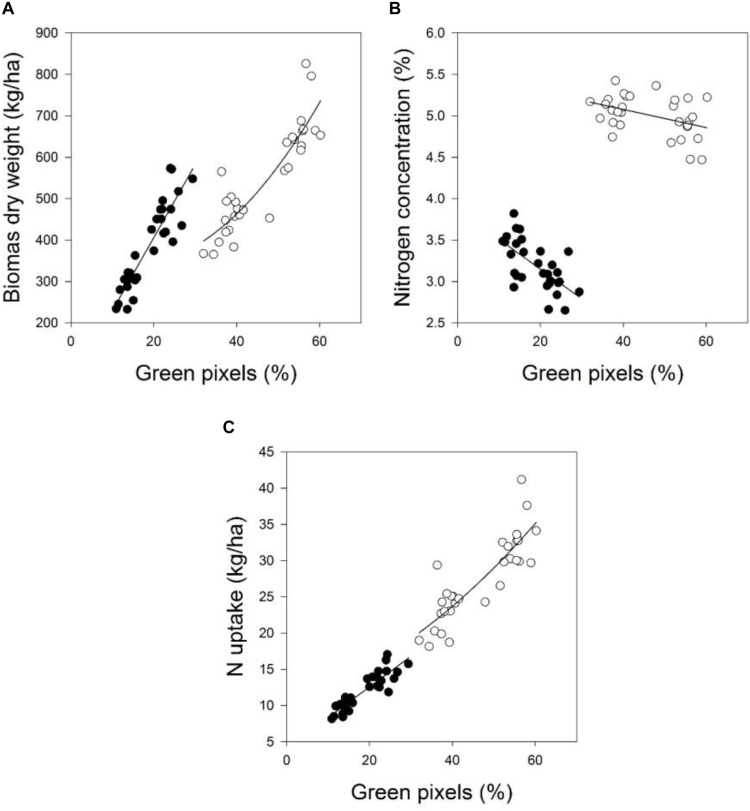
FIGURE 2.
The relationship between green pixels percentage obtained from image analysis and the destructively obtained parameters (A) biomass dry weight, (B) nitrogen concentration, and (C) N uptake of wheat at four growth stages in 2016. Statistical information is given in Table 6.

