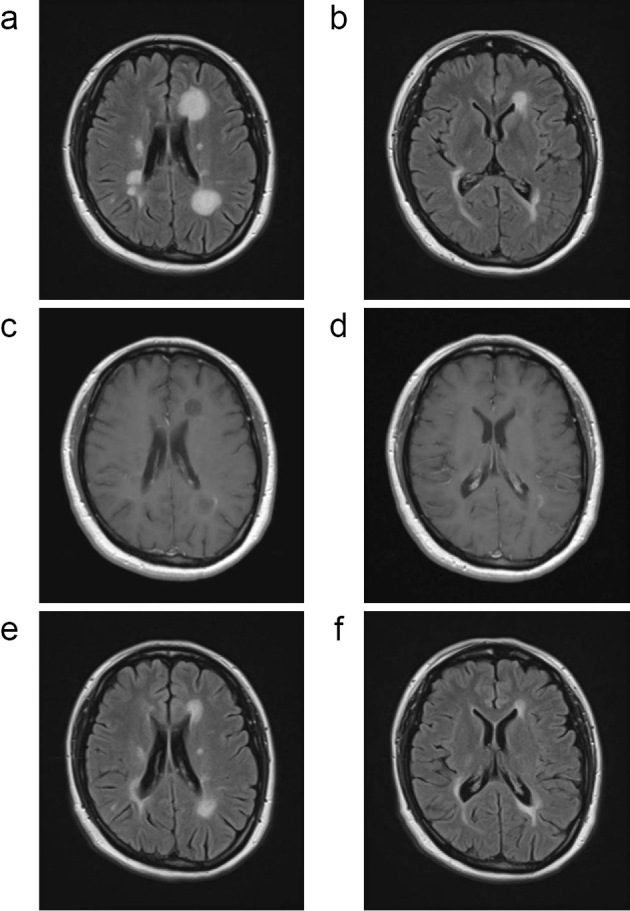
Figure 5.

Magnetic resonance imaging findings of group III (Patient 10). In patient 10, brain magnetic resonance imaging (MRI) 78 days after fingolimod cessation demonstrated the enlargement of lesions (a-d). Repeated steroid pulse therapy led to a gradual improvement in the tumefactive demyelinating lesions (TDLs) (e-f) (a, b, e, f; FLAIR, c, d; Gd-enhanced T1-weighted image).
