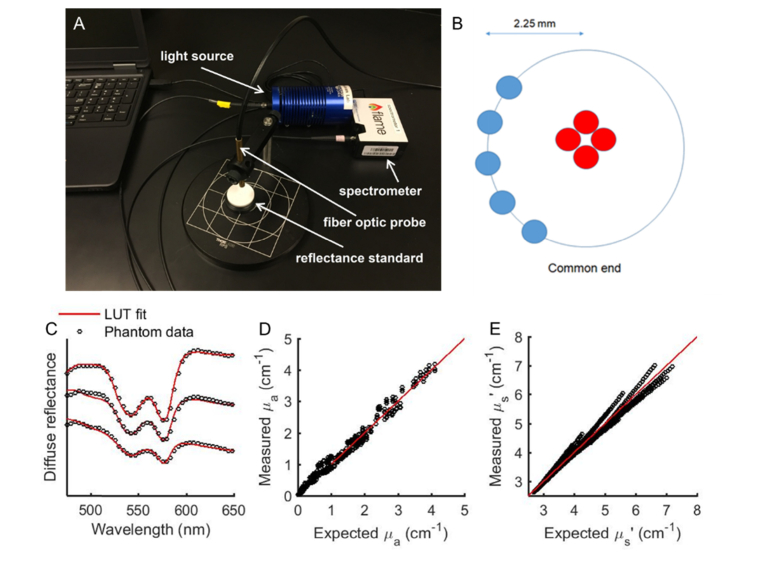
Fig. 2.
(a) Experimental DRS setup shows fiber optic probe, spectrometer, light source, and reflectance standard (b) Optical probe design with source-detector separation of 2.25mm. (c) DRS spectra and respective LUT-fits from 3 representative tissue-simulating phantoms with varying levels of scattering and absorption. (d) and (e) Scatter plots of known versus measured values of µa and µs’, where solid line indicates perfect agreement.

