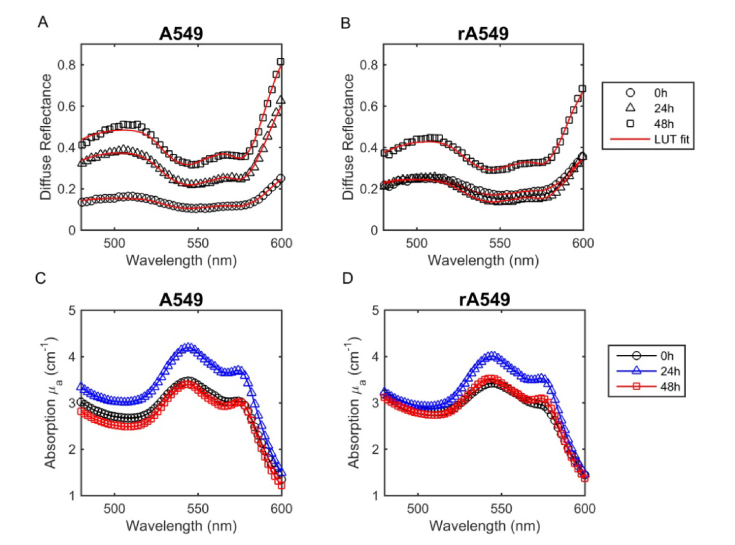
Fig. 3.
Representative in vivo DRS spectra and absorption spectra prior to radiation (0h), 24 hours post-radiation, and 48 hours post-radiation. Spectra collected from A549 parental tumors (a,c) and rA549 radiation-resistant tumors (b,d). The measured diffuse reflectance and absorption are presented as symbols and the solid lines indicate the LUT model fit.

